Mobile vs Web App Revenue 2026: A Data-Driven Economics & Profitability Analysis

The global app economy is a juggernaut, with the Apple App Store ecosystem alone facilitating $1.3 trillion in developer billings and sales in 2024. Yet, as I consult with C-suite executives daily, I see a persistent hesitation: “Do we build a native app and hand over 30% to Apple, or do we build a web app and fight for user retention?”

This is not just a technical debate; it is a fundamental financial decision. With global consumer spending on apps reaching $167 billion in 2025, the stakes are incredibly high. The rise of AI-powered applications has further complicated the landscape, creating new revenue streams that defy traditional categorization.

In this article, I will move beyond the surface-level “pros and cons” to provide you with hard data. We will analyze revenue per download, retention rates, commission structures, and the exploding SaaS market to help you make an investment decision backed by the latest 2025–2026 statistics.

Key Takeaways | App Store vs Web App Revenue Statistics (2025–2026)

  • Consumer Spending on Apps: $167B in 2025 (Statista)
  • Web App Market: $408 Billion SaaS Market (2025) – According to Zylo, web apps dominate enterprise monetization, projected to hit $465.03B in 2026 (18.7% CAGR).
  • Gaming vs Non-Gaming Shift: Gaming hit $82B on iOS, but non-gaming apps grew faster at 21% YoY, signaling diversification of mobile revenue streams. (Electroiq)
  • Hybrid Strategy Dominates: Combining web + mobile + subscriptions + ads often outperforms single-channel approaches in ROAS, retention, and ARPU.
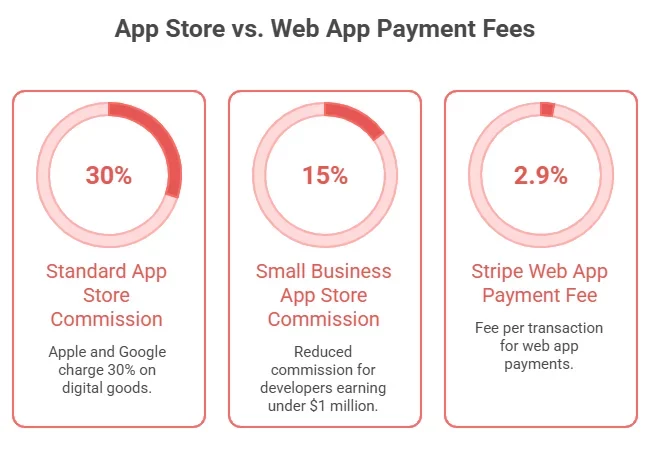
  • Platform Fees Impact Profitability: App Store commissions (15–30%) drastically reduce margins compared to web apps (~2.9% + $0.30).
  • Retention Drives Revenue Sustainability: Yearly subscriptions retain 44.1% of users, compared to 17% monthly and 3.4% weekly, making LTV:CAC a critical metric.
  • Web Apps Win in B2B SaaS: Lower CAC, predictable revenue, and cross-platform compatibility make web apps ideal for enterprise monetization.
  • iOS Leads in Consumer Revenue: Despite a smaller market share, iOS generates higher ARPU ($138 vs $72) and Revenue Per Install ($0.38 vs $0.14).
  • Regulatory Risks Are Real: EU DMA reduces platform control over payments, potentially lowering commission “leak” and encouraging hybrid strategies.
  • PWAs Are a High-ROI Alternative: Businesses report 36% higher mobile conversions and faster load times after switching to Progressive Web Apps.
  • CAC Can Make or Break Profitability: Mobile CPI is high (~$3.60–$5.50 iOS), which makes web channels more efficient for long-term unit economics.

What Are the Global App Store Revenue Statistics for 2025?

In 2025, global consumer spending on premium apps, in-app purchases, and subscriptions reached $167 billion, marking a 10.6% year-over-year increase. Despite market saturation, this steady growth confirms that users are increasingly willing to pay for high-value digital experiences.

Expert Opinion:
Discussions about App Store and Web App revenue often narrow to commission percentages and conversion rates. While useful, it’s important to zoom out: revenue exists within a larger system of governance, incentives, regulations, and user experience. Leaders designing distribution models should consider these forces to strengthen long-term value flow.
– Dr. Casey LaFrance, Professor & Program Manager

Total Revenue Generated by App Stores

The divide between the two giants continues to widen in terms of raw dollars:

Apple App Store Revenue

$117 billion

Google Play Store Revenue

$49 billion

Looking at quarterly trends, global in-app purchase (IAP) revenue reached $39.3 billion in Q1 2025 and rose to $40.9 billion in Q2 2025. This consistent quarter-over-quarter growth indicates a stable habit of digital spending among consumers.

iOS vs Android Revenue Split

Metric iOS Android
Global User Share 30% 70%
App Revenue Share 63% 37%
Annual ARPU $138 $72
Revenue Per Install (60 days) $0.38 $0.14

This table highlights that despite Android’s larger user base, iOS generates significantly more revenue per user and per install, making it the preferred platform for high-value app monetization.

For businesses targeting high-value iOS users, execution quality is critical. At AppVerticals, our mobile app development services are built to optimize performance, maximize subscriptions, and drive long-term retention, not just downloads.

Category-Level IAP Revenue

Where is the money flowing? In 2025, we saw distinct winners:

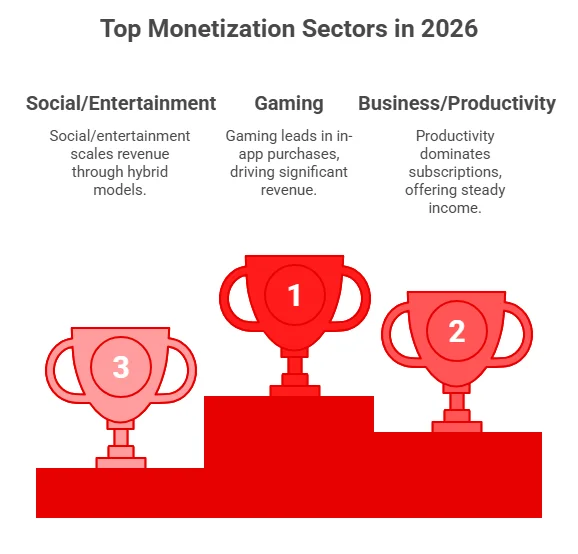
  • Gaming: $82 billion (iOS alone), remaining the titan of the industry.
  • Social Networking: $16.7 billion, driven by creator economies and premium subscriptions.
  • Entertainment: $12.5 billion (streaming services).
  • Shopping: $9.3 billion.
  • Health & Fitness: $6.3 billion, showing a remarkable 24% year-over-year growth.

What Are the Web App Revenue Statistics & Monetization Trends for 2026?

In 2026, web apps continue to dominate business productivity and enterprise revenue, serving as the backbone of the rapidly expanding SaaS economy. While mobile apps lead in consumer spending, web applications power recurring B2B monetization models, high-ticket subscriptions, and scalable digital infrastructure.
Top Web App Monetization Strategies

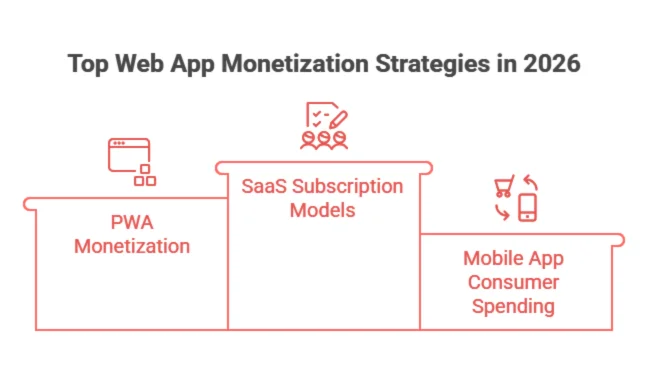
SaaS Growth & Subscription Models

The SaaS market is robust. Valued at $408.21 billion in 2025, it is projected to grow to $465.03 billion in 2026. With a Compound Annual Growth Rate (CAGR) of 18.7%, this sector is creating massive enterprise value. Unlike mobile apps, which rely heavily on impulse purchases or microtransactions, SaaS web apps benefit from recurring, high-ticket B2B contracts.

PWA Monetization Statistics 2026

Progressive Web Apps (PWAs) are no longer experimental. The market is projected to reach $21.44 billion by 2033, growing at a CAGR of 29.9%. By 2025, it is estimated that 65% of businesses will have adopted PWAs.

The performance benefits are tangible: businesses switching to PWAs report 36% higher mobile conversions and 50% faster load times. At AppVerticals, we design high-performance applications that combine search visibility with near-native retention mechanics, making them an increasingly strategic middle ground

Web App vs App Store Revenue (Side-by-Side)

To help you visualize the trade-offs, I have compiled a direct comparison of the economics of both platforms.

Metric Native App Store (iOS/Android) Web App / SaaS
Revenue Potential $167B Consumer Spend $408B SaaS Market (B2B + Enterprise)
Commission / Fees 15%–30% per transaction ~2.9% + $0.30 per payment (Stripe/Processors)
Customer Acquisition Cost High (CPI $4.70 iOS / $3.40 Android) Moderate (SEO, Content, PPC)
Refund Rates Higher (Store policies) Lower (Controlled by merchant)

Takeaway: For B2C apps, App Store access comes with higher fees but direct access to consumers. For B2B SaaS, web apps allow lower transaction fees and more predictable enterprise revenue.

Still Unsure Which Model Maximizes Your Revenue?

Whether you need a high-ARPU iOS app or a margin-optimized SaaS platform, AppVerticals engineers products built for profitability, not just downloads.

How Do ARPU, Retention, and Platform Risks Affect App Revenue?

ARPU, retention, and platform risk drive app profitability, determining revenue potential and business stability.
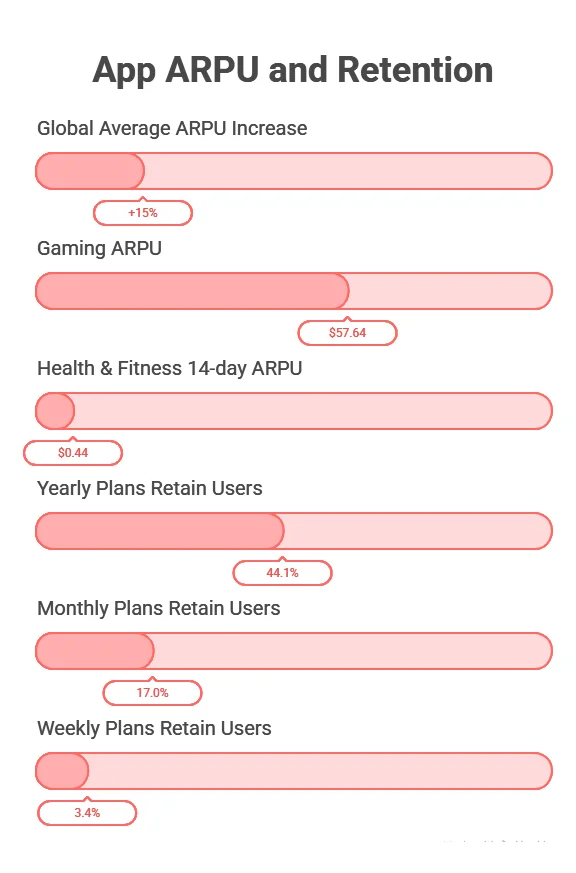
Expert Opinion: 
Compared to web apps, mobile apps generally function better due to advanced features and easier tracking of technical glitches.

ARPU Comparison

Global average ARPU for mobile apps increased by 15% to reach $4.80 in 2025. However, this average hides massive category variance. Gaming ARPU is significantly higher at $57.64. In the subscription space, Health & Fitness apps see a median 14-day ARPU of $0.44.

Retention Impact on Revenue

Retention is the silent killer of app revenue. Data shows that yearly plans retain 44.1% of users, while monthly plans retain only 17.0%, and weekly plans plummet to 3.4%. Web apps, particularly B2B SaaS, generally enjoy higher retention due to their integration into business workflows, whereas consumer mobile apps fight a constant battle against churn.

Platform Dependency Risk

Native apps face “platform risk.” In 2024, Apple terminated over 139,000 developer accounts over fraud concerns. A policy change or an algorithm update can wipe out a business overnight. Web apps offer autonomy; you own the distribution channel, the payment relationship, and the customer data without a gatekeeper.

App ARPU and Retention

Why Do Web SaaS Products Often Have Healthier LTV:CAC Ratios Than Mobile Apps?

For subscription SaaS or web products, LTV-heavy models with predictable churn and sticky users often exceed a 3:1 LTV:CAC ratio, which is typically considered strong and sustainable.

CAC, however, can increase dramatically for mobile apps due to rising CPI. Acquisition costs have surged globally over the past decade and remain high in core markets (e.g., iOS CPI ~$3.60‑5.50).

Scenario LTV CAC LTV: CAC Status
Web SaaS Subscriptions $300 $80 3.75 Healthy
Mobile App (iOS/Android) $75 $50 1.50 Unsustainable

The comparison shows why web apps often produce more efficient unit economics, because CAC doesn’t spike as much as in mobile paid acquisition channels.

Regulatory / DMA (Digital Markets Act) Impact on App Store Economics

Regulation is no longer an abstract risk; it already reshapes platform economics.

EU Digital Markets Act (DMA) Changes

  • Apple must allow alternative app marketplaces, external payment links, and sideloading within the EU, breaking its exclusive control over payments.
  • The DMA also requires app stores to treat developers and users with less restrictive payment rules, reducing Apple’s ability to lock customers into its 15–30% commission.
  • The European Commission fined Apple €500M for DMA non‑compliance related to anti‑steering policies, reinforcing regulatory pressure.
  • Apple’s response includes a two‑tier Store Services fee model in the EU, where developers can choose a 5% tier with limited features or a 13% tier for full features, which may significantly alter revenue share economics within that region.
Implication: Regulators are rebalancing platform power between app stores and developers. This may reduce the 30% commission leak on mobile revenue and create hybrid distribution strategies where purchases are diverted to the web to keep more revenue.

Do Hybrid Monetization Models Outperform Single-Channel Approaches?

Data shows that hybrid monetization models outperform single‑channel approaches, especially for complex monetization.

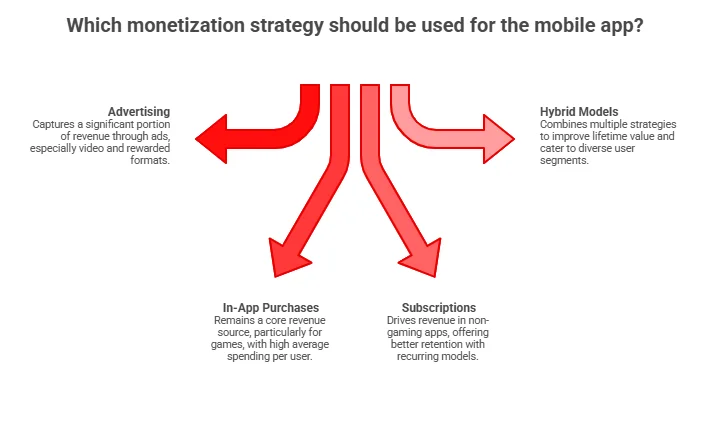
Hybrid Monetization (Mobile + Web + Ads + Subscriptions)

  • Apps that combine subscriptions, ads, and web billing often deliver higher ROC and retention than single models alone.
  • According to a major monetization report, hybrid models in mid‑core mobile genres reached 146% ROAS by Day 90, compared with 93% for pure in‑app purchases and 58% for ad‑only models.
  • Hypercasual hybrid monetization increased ARPU by 28% compared to ad‑only.

Key Benefits of Hybrid

Hybrid Strategy Element Core Benefit
Web Billing + App Access Lower fees, more pricing flexibility
In‑App Subscriptions + Ads Smooth revenue diversification
Owned Media (email, push, SEO) Better retention, reduced CAC reliance
Web‑to‑App Funnels Taps untapped web audience for mobile installs

Hybrid strategies help mitigate platform risks, distribute CAC spend more efficiently, and build multiple revenue levers (web + mobile + owned channels).

Commission Structure: Does Apple & Google Take 30%?

Yes. Both Apple and Google typically take 30% commission on app sales and in-app purchases, though there are some reductions for small developers or subscription-based apps after the first year. This “Apple Tax” (and Google equivalent) remains a major consideration for app monetization. Here is the reality of the fee structure in 2025/2026:

Standard 30% Commission Model

By default, Apple charges a 30% commission on all digital goods and services sold through the App Store. Google Play has a similar structure, charging 30% on revenues after the first $1 million.

Small Business 15% Program

However, it is crucial to note the exceptions. The App Store Small Business Program reduces the commission to 15% for developers earning less than $1 million per year. Google offers a similar 15% rate for the first $1 million in revenue annually for every developer.

Web App Payment Gateway Fees

Contrast this with the web. Using a provider like Stripe, you pay approximately 2.9% + $0.30 per transaction. For a business generating $500,000, the difference between paying 15% ($75,000) to Apple and ~3% ($15,000) to Stripe is $60,000 in pure profit. That is the capital that could fund two additional engineers or a marketing campaign.

App Store vs. Web App Payment Fees

How Much Can 1,000 Downloads Make? (Revenue Modeling Formula)

A common question I receive from founders is, “What is a download worth?” Let’s break down the math.

Revenue Per Download Benchmarks

Statista reports that the global average revenue per download is expected to amount to $1.86. However, platforms matter. As mentioned earlier, the App Store Revenue Per Install (D60) is $0.38 compared to Google Play’s $0.14.

Subscription vs IAP vs Ads

The reality of monetization is harsh. Studies indicate that only 0.6–0.7% of new apps reach $100,000 in monthly revenue within their first 12 months.

The 1,000 Download Formula:

Using the global average:

1,000 Downloads × $1.86 = ~$1,860 Total Revenue

Note: This is an average. High-performing apps can see revenue per install of $0.63 or higher within 60 days.

Which Type of App Is Most Profitable in 2026?

Profitability depends entirely on your business model.

Gaming vs SaaS vs E-Commerce

Gaming remains the revenue giant with $82 billion on iOS, but growth has slowed to roughly 1% YoY. In contrast, non-game apps surged 21% year-over-year to reach $85.6 billion. Meanwhile, the SaaS web market is vast ($408B+) and growing steadily at an 18.7% CAGR.

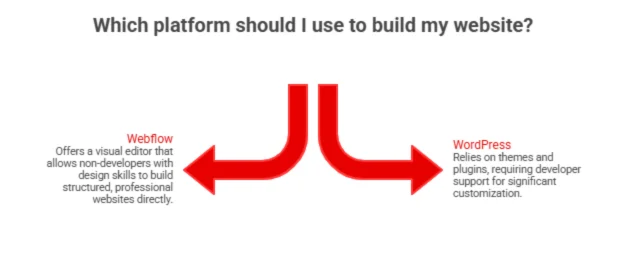
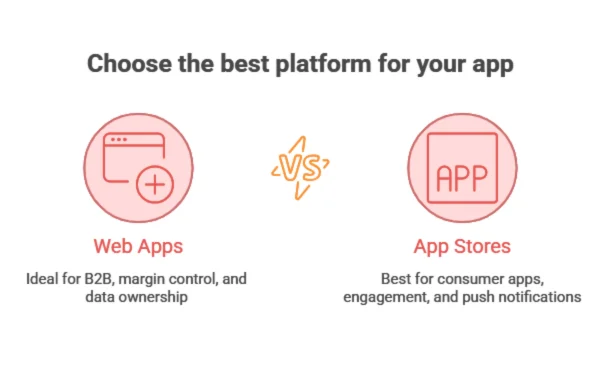
When Web Apps Outperform Native Apps

Web apps win in the B2B space. If you are building enterprise resource planning (ERP) tools, CRM software, or niche B2B platforms, the web offers higher margins (no 30% fee) and lower friction (no download required). Cross-platform compatibility is inherent, reducing development costs.

Many B2B platforms we build at AppVerticals prioritize margin control and data ownership. Our custom web application development helps businesses reduce platform dependency while maximizing recurring revenue.

When App Stores Dominate

If your product relies on consumer impulse, social interaction, or high-performance graphics (like gaming), the App Store is unbeatable. The frictionless “double-click to pay” mechanism of Apple Pay and the push notification ecosystem drive engagement that web apps struggle to match.

best platform for your app

Cost Comparison: Mobile App vs Web App (2025–2026)

Investment cost is only one half of the profitability equation; development cost, platform fees, maintenance, and monetization structure all impact ROI differently on mobile vs web.

Here’s a data‑verified breakdown of development and revenue dynamics for mobile apps and web applications:

Mobile App Revenue Environment (Mobile vs Web)

  • The global app ecosystem facilitated $1.3 trillion in billings and sales in 2024, underscoring the massive economic scale of mobile platforms, with developers capturing most of this value in digital goods and services.
  • Mobile in‑app purchase revenue alone reached $167 billion in 2025, driven by deeper engagement and recurring spending.
  • Consumer spending via apps continues to grow even as downloads stabilize.

In contrast, the web app / SaaS ecosystem is being valued for enterprise subscription revenue rather than consumer micro‑transactions.

  • The global SaaS market was valued at $408.21 billion in 2025 and is projected to expand further in 2026, indicating a strong recurring revenue base for web apps. (Zylo)

Mobile App Development Cost (Typical Ranges)

Mobile app development costs largely depend on complexity, platform, and feature set.

App Type Development Cost Estimate
Simple Mobile App ~$25,000 – $60,000
Mid‑Complex Mobile App ~$60,000 – $120,000
Complex Mobile App ~$120,000 – $500,000+

Notes: Community and industry breakdowns show that development cost estimates vary by platform and feature scope, but seasoned estimates align with the above ranges for modern app builds.

Web App Development Cost

Web apps, especially SaaS, PWAs, and enterprise dashboards, usually cost 20–40% less in upfront development compared to mobile apps because they use a single codebase and don’t require separate iOS + Android builds.

Web App Type Typical Cost Range
Simple / MVP Web App ~$20,000 – $40,000
Mid‑Tier Web App ~$40,000 – $100,000
Complex SaaS Web Platform ~$100,000 – $350,000+

 Ongoing Maintenance & Operational Costs

Maintenance isn’t just a number; it’s recurring CapEx that impacts profitability:

  • Mobile apps typically incur 15–30% of initial build costs per year for ongoing maintenance, infrastructure, and platform updates.
  • Web app maintenance can be lower since one codebase serves all devices, and updates are deployed centrally.

Monetization Fee Structures

Platform Fee Structure
Mobile App Stores (Apple/Google) 15–30% commission on digital sales
Web Apps (Stripe/Square) ~2.9% + $0.30 per transaction

Contrasting these fee structures clearly shows the impact on profitability at scale, especially for subscription and digital goods revenue.

For example, A business earning $500,000 paying ~15% in platform commission loses ~$75,000, whereas the same volume via Stripe fees (~3%) might cost just ~$15,000.

(The comparatively low web fee structure is well known among product monetization experts and reflected across web monetization guidance.)

Revenue Strategy & Implications

Metric Mobile App Web App
Upfront Development Cost Higher Lower
Ongoing Maintenance Higher Lower
Platform Fee / Commission 15–30% ~3% + fixed
Time to Market Longer due to separate releases Shorter via single deploy
Monetization Focus Consumer in‑app purchases/subscriptions Recurring SaaS revenue, enterprise contracts
CAC Impact Higher user acquisition costs via CPI & ads Lower CAC via SEO, content marketing

In short, Web apps typically outperform mobile apps in unit economics due to:

  • Lower initial development cost (20–40% less vs mobile)
  • Lower ongoing maintenance and update overhead
  • Lower transaction fees (~3% vs up to 30%)
  • Strong SaaS recurring revenue base (valued at >$408B)

Meanwhile, mobile apps still generate significant consumer revenue (e.g., $167 billion in 2025 mobile spend) and are excellent for engagement-intensive products, but their higher acquisition and fee structures must be factored into profitability modeling.

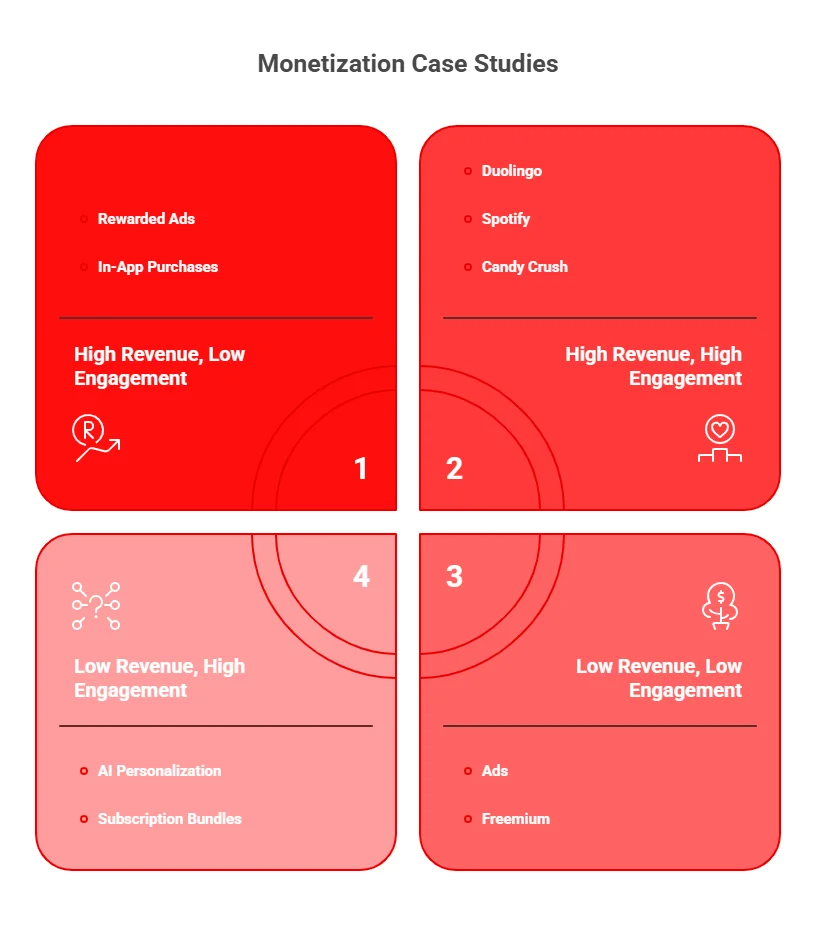
Real‑Life Case Studies & Revenue Impact Examples

App Store Developer Revenue Growth | U.S. Ecosystem

One of the strongest real‑world indicators of mobile app economics is how much revenue developers generate through the App Store. In 2024, the Apple App Store ecosystem in the U.S. facilitated $406 billion in developer billings and sales, nearly tripling since 2019 (from $142 B). Developers’ earnings more than doubled over that period.

App Store in India | Developer Earnings

In 2024, developers on the Apple App Store in India generated $5.3 billion in billings and sales. Notably, a large share (~94%) of this commerce accrued directly to developers, meaning Apple wasn’t taking commission on the majority of these transactions (often physical goods or services).

Progressive Web App (PWA) Real‑World Performance

Progressive Web Apps are often overlooked but can unlock significant improvements in engagement and conversions:

Rakuten 24 (Japan) PWA Impact

  • Visitor retention increased by 450% (installable PWA vs old mobile web)
  • 150% higher sales per customer
  • 200% conversion gains
  • Results achieved in just one month

ScandiPWA E-commerce Case

SaaS Revenue Model Example | Slack

Though not a classic mobile vs web case, Slack remains one of the best-documented SaaS growth and revenue model case studies. Within eight months of launch, it reached a $1 B valuation and grew to >$100 M annual recurring revenue (ARR) within a few years, showcasing the power of subscription‑driven web revenue.

2026 Revenue Forecast: Mobile vs Web Ecosystem

By 2026:

  • The global mobile app market is projected to exceed $330 billion, driven by consumer subscriptions, in-app purchases, and AI-driven app monetization.
  • Meanwhile, the global SaaS market is expected to surpass $500+ billion, fueled by enterprise digital transformation and subscription-based web platforms.

While mobile continues expanding in consumer engagement, web-based SaaS platforms are growing faster in enterprise revenue concentration and margin efficiency.

By 2026, experts at AppVerticals predict a hybrid strategy will not just be an option, but a requirement for market dominance.

More Related Guides:

What is Warehouse Management Software (WMS)? A Complete Guide for 2026

The Warehouse Management System (WMS) market is projected to grow from USD 4.38B in 2026 to USD 10.64B by 2034, driven by e-commerce, omnichannel demands, and automation.

Order picking alone typically represents 50–55% of total warehouse operating expense, making it the single largest lever for operational efficiency.

A WMS is more than just an inventory tracker; it’s an important tool that optimizes the movement of goods from receiving and put-away to inventory control, picking, packing, and shipping. By reducing labor and error costs, a WMS directly improves operational efficiency, margin, customer experience, and working capital.

For businesses investing in logistics software development, a tailored WMS solution is crucial in addressing these pain points, streamlining operations, and ultimately boosting the bottom line. This guide will cover how investing in the right WMS can address these key pain points, streamline your logistics, and ultimately boost your bottom line.

Key Takeaways:

  • 82% of supply chains are expected to adopt AI within the next 5 years, emphasizing the importance of clean execution data from WMS for AI integration.

  • 55% of warehouse operating costs come from picking, making it a critical area for optimization with WMS to improve efficiency and reduce costs.

  • Robot shipments in warehouses are projected to grow by up to 50% annually through 2030, underlining the need for a cohesive WMS to orchestrate automation.

  • 58% of warehouse decision-makers plan to implement RFID by 2028, helping to address stockouts and inventory inaccuracies with better real-time visibility.

  • WMS implementation costs range from $9,000–$18,000 for setup, with monthly subscriptions ranging from $100–$500 per user, depending on the system’s scale and features.

  • A WMS can significantly improve inventory accuracy, which is currently at an average of 83%, closing the gap on hidden costs due to miscounts and errors in warehouse operations.

What Are the Main Benefits of Warehouse Management Software?

A Warehouse Management System (WMS) drives significant improvements in operational efficiency, cost reduction, and scalability. By streamlining inventory management and optimizing warehouse processes, a WMS enhances accuracy, productivity, and visibility, while freeing up cash and reducing risk.

Here are the key benefits of WMS that directly impact P&L, cash flow, and risk:

benefits of a warehouse management system

1. Higher Order Accuracy (Fewer Costly Reships/Returns)

Many businesses think their inventory is accurate, until they measure it. A modern WMS enforces scan-confirmed receiving and picking, plus structured cycle counts, raising accuracy levels significantly. Only 69% of companies track inventory accuracy, with an average of 83% in 2024.

2. Lower Fulfillment Costs Through Labor Productivity

Order picking typically accounts for about 55% of warehouse operating costs. A WMS can reduce these costs by optimizing pick paths, interleaving tasks, and utilizing wave planning. Even small reductions in travel time and exception handling result in significant savings.

3. Real-Time Visibility (Inventory + Work-in-Progress)

According to Zebra’s global study, 91% of decision-makers expect to use technology to enhance supply chain visibility in the next five years. A WMS provides up-to-the-minute insights into inventory and work-in-progress, eliminating blind spots.

4. Scalability without Linear Headcount Growth

A WMS naturally supports automation, with 69% of warehouse decision-makers planning to automate workflows. As the control layer for automation, the WMS helps scale operations without the need to hire additional staff, increasing efficiency as you grow.

5. Faster Onboarding and Process Standardization

A WMS turns tribal knowledge into standardized workflows, reducing dependency on specific individuals and improving process auditability. This ensures that staff can be onboarded more quickly and procedures are consistently followed.

6. Better Working Capital Control

Inventory errors can lead to phantom stock, unnecessary safety-stock levels, and costly expedited replenishment. A WMS improves inventory accuracy, making purchasing more reliable and freeing up cash that would otherwise be tied up in stock.

Transform Your Warehouse Operations Today

Discover how a custom WMS can streamline your processes, boost efficiency, and cut costs.

What Are the Four Types of Warehouse Management Systems?

When executives ask me, what type of warehouse management system in logistics should we buy or build? I break it down into four main models. Each has its strengths, and the best fit depends on complexity, timeline, and how closely you want your warehouse operations integrated with finance and planning.

types of wms software

Standalone WMS (Best-of-Breed Execution)

Standalone systems focus exclusively on warehouse execution, labor management, slotting, wave planning, multi-client 3PL billing, and more. This model is common in 3PLs and complex distribution environments where warehouse optimization must operate independently of ERP release cycles.

ERP-Integrated WMS (Module Inside Your ERP)

This model lives “inside” the ERP system, making it easier to align master data (items, customers, general ledger). The tradeoff is that while it provides faster data alignment, it may offer less depth in advanced warehouse optimization compared to top-tier standalone systems, depending on the vendor and edition.

Cloud-Based WMS (SaaS WMS)

A cloud-based WMS shifts infrastructure management and updates to the vendor, which often leads to faster deployment across multiple sites. Fortune Business Insights notes that cloud deployment is a key driver of WMS growth, owing to its scalability and cost-efficiency.

Supply Chain Suite Modules (WMS as Part of a Broader SCM Layer)

In this model, WMS is just one module within a broader supply chain execution ecosystem (WMS + TMS + order orchestration + planning signals). This is ideal when you need network-wide coordination, not just operations within a single warehouse.

How Does Warehouse Management Software Work?

A best WMS software works as a closed-loop control system that converts demand (orders) into tasks (work), verifies execution (scan/confirm), updates inventory in real time, and escalates exceptions.

Here’s how the process should look like:

warehouse management software process

Step 1. Receiving (Inbound)

The WMS ingests ASN/PO/inbound shipments from ERP, suppliers, or EDI. It handles unloading and verification, checking for counts, damages, and capturing lot/serial data. Then, it labels and assigns pallet/tote IDs before directing put-away based on defined rules (e.g., temperature zone, velocity, hazard class, or available locations).

WMS workflows reduce errors like miscounts or misplaced goods by enforcing structured verification and accurate handling.

Step 2. Inventory Management (The Perpetual System of Record)

WMS manages real-time on-hand inventory by bin and location, along with lot/serial expiration controls, cycle counting programs, and discrepancy workflows. It ensures inventory status controls (available, QC hold, damaged, quarantine), addressing gaps in inventory accuracy.

With the average inventory accuracy at 83%, according to CAPS Research, WMS improves execution and

Step 3. Picking (The Cost Center)

Picking typically accounts for around 55% of warehouse operating costs, making it a critical area for optimization. A WMS supports batch/wave picking, zone picking, pick path optimization, and pick-to-tote or pick-to-cart logic.

It ensures accuracy with scan-confirmed item, quantity, and location, transforming picking from a cost center to a source of operational efficiency and cost savings.

Step 4. Packing

WMS optimizes packing with cartonization logic to ensure the right-size packing for items. It verifies the packing process by scanning items into the cartons and handling inserts, labels, and compliance documents. This ensures that packing is efficient, accurate, and compliant with shipping standards.

Step 5. Shipping

WMS handles carrier selection and manifesting, often through integration with external systems. It supports load planning, staging, and ship confirmation, providing real-time order status updates back to the ERP or Order Management System (OMS). This streamlines the shipping process, ensuring orders are shipped promptly and accurately.

Each section of the WMS process is designed to increase efficiency, accuracy, and real-time visibility, ultimately leading to cost savings and better operational control.

Additional Functionalities to Enhance Warehouse Efficiency

To further improve warehouse operations, here are some critical functions that a WMS can provide:

  • Labor Management

A WMS provides real-time insights into labor-related costs and productivity, allowing businesses to optimize labor utilization. It tracks key metrics such as response times and productivity gaps, helping companies make informed decisions. Task interleaving features allow the WMS to assign tasks based on factors like proximity or priority, reducing travel time and minimizing wasted time (“deadheading”).

  • Yard and Dock Management

WMS can help optimize yard and dock operations by guiding truck drivers to the right loading docks quickly. Additionally, it supports cross-docking, ideal for products that need to move quickly, such as fresh groceries. The system can check receiving scans against sales orders and alert the receiver if goods need to be cross-docked for immediate shipment.

  • Warehouse Metrics and Analytics

Real-time data collection through a WMS eliminates manual errors and speeds up processes. This data can be integrated with analytics to track key performance metrics, such as:

  1. On-time shipping
  2. Inventory accuracy
  3. Distribution costs
  4. Order cycle time
  5. Order fill rate

The WMS generates visual reports that can be easily shared with stakeholders and used for decision-making to drive continuous improvement.

How Does Warehouse Management Software Integrate with ERP Systems?

In my experience, ERP integration is where WMS implementations either accelerate progress or become budget sinkholes. Integration goes beyond just connecting orders; it’s about synchronizing a living system: items, units of measure, locations, inventory status, shipments, returns, and adjustments.

Here’s the list of common integration patterns I’ve observed:

  • Direct API Integration (ERP ↔ WMS): Modern platforms expose REST APIs to enable real-time data exchanges. For instance, Oracle Warehouse Management Cloud offers REST APIs to push or retrieve data in real-time, ensuring smooth data flow between systems.
  • Middleware / iPaaS Layer: When data models differ or you’re working with multiple ERPs, OMS, or carriers, an Integration Platform as a Service (iPaaS) is often used. iPaaS acts as a translation and workflow layer, helping systems with connectors, transformation, workflows, monitoring, and governance. It ensures smooth data transfer even when platforms don’t match.
  • WMS-Only Mode with an External ERP: A strategy I recommend is using Warehouse Management Only Mode, as demonstrated by Microsoft’s Dynamics 365 Supply Chain Management. This allows you to modernize warehouse execution without overhauling your finance or order processing systems. It’s an effective way for CFOs to balance innovation with risk containment.

Typical Integration Challenges (and How to Reduce Them)

Integration Challenge How to Reduce It
Master Data Drift (Items/UOMs/Customers) Set clear system-of-record rules, automate sync jobs, and create exception queues to handle discrepancies.
Timing and Status Mismatches (What Does “Shipped” Mean?) Define canonical statuses and event triggers early in the process to ensure all systems agree on key definitions (e.g., what constitutes a “shipped” order).
Inventory Ownership / Multi-Client Complexity Ensure your WMS supports ownership tracking for multi-client operations or multiple entities. Microsoft’s external ERP mode addresses ownership patterns.
API Governance Use iPaaS to move and transform data, while API management governs and secures the APIs, ensuring smooth communication across platforms.
ERP-Suite Integration Example (For SAP Leaders) SAP’s embedded Extended Warehouse Management (EWM) in S/4HANA integrates a unified data model, reducing duplicated interfaces and simplifying processes.


Seamless ERP and WMS Integration

Want to integrate WMS with your ERP systems? Let us guide you through the process with smooth, error-free syncing.

How Is AI and Automation Changing Warehouse Management?

AI and automation are transforming warehouse management, driving innovation at the board level and across operations. Here’s how these technologies are shaping the future of warehousing:

AI Adoption is Accelerating Across Supply Chains

According to MHI and Deloitte, AI usage in warehouses is on the rise, with 28% currently using AI and 54% planning to adopt it in the next five years, bringing the total to 82% within five years. The key to unlocking AI’s value lies in having clean execution data, something a WMS provides.

This data feeds AI algorithms, enabling smarter decisions, predictive analytics, and more efficient operations.

Warehouse Robotics and Automation Are Scaling

McKinsey reports that robot shipments are expected to increase by up to 50% annually through 2030, and warehouse automation is growing at over 10% per year. However, automation projects often fail without a cohesive vision and strong alignment with operations.

The WMS acts as the orchestration layer, ensuring that automation is seamlessly integrated into warehouse workflows. Without it, automation efforts risk being misaligned and chaotic.

RFID, Scanning, and “Visibility Tech” Are Becoming Mainstream

Zebra’s research shows that 58% of warehouse decision-makers plan to deploy RFID by 2028, and 91% expect to use technology to enhance supply chain visibility. This isn’t just a trend, it’s a direct response to challenges like stockouts, inaccurate inventory, and labor strain. RFID and visibility technologies provide real-time insights, improving inventory accuracy, and operational efficiency.

AI, automation, and visibility technologies are not just changing the way warehouses operate, they’re reshaping how supply chains function on a global scale. A WMS integrated with these innovations helps unlock new levels of efficiency, accuracy, and scalability.

What is the Cost of Warehouse Management Software?

On average, building a custom Warehouse Management System (WMS) can cost anywhere from $50,000 to $500,000, depending on the complexity and scope. In contrast, implementing an off-the-shelf WMS typically ranges from $9,000 to $200,000, factoring in pricing models, system complexity, and the size of your operation.

The total cost of ownership (TCO) includes more than just the upfront price, it also encompasses setup, integration, ongoing subscriptions, and maintenance.

Implementation Cost vs. Custom Development

While implementation costs cover the price of adopting an existing WMS solution, developing a custom WMS involves additional costs for design, development, and ongoing maintenance. A custom solution allows for tailored functionality but comes with higher upfront development costs, typically $50,000 to $500,000 or more, depending on the complexity and scope of features.

Common Pricing Models

SaaS Subscription (Cloud WMS): Typically priced per user, site, or transaction volume. SaaS solutions have lower upfront costs, hosted and maintained by the vendor, making them scalable and easy to update.

  • Setup Cost: ~$9,000–$18,000
  • Subscription: ~$100–$500 per user/month

Perpetual/On-Prem Licensing: Involves large upfront costs with annual maintenance fees. Often chosen for legacy systems or specific regulatory needs but requires more in-house IT resources.

  • Cost Range: $2,500–$200,000 per facility, plus annual maintenance

Hybrid: A mix of on-prem control with cloud synchronization, used for situations requiring local data control but with cloud flexibility.

  • Setup and Subscription Costs: Varies by size and scope.

SaaS vs. On-Prem:

SaaS is typically more cost-efficient upfront with lower IT maintenance costs, while on-prem solutions have higher initial setup costs and require ongoing internal management.

ROI Justification

The ROI for a WMS often comes from improving efficiency in picking, which accounts for ~55% of warehouse operating costs. Key savings include:

  • Fewer mis-picks and short-ships
  • Higher throughput per labor hour
  • Reduced inventory padding and improved working capital

With average inventory accuracy at 83%, many businesses are unknowingly absorbing costs from errors, expedited shipments, and lost sales. A WMS directly addresses these inefficiencies, offering a solid return on investment.

Investing in a WMS not only optimizes operations but also reduces hidden costs, positively impacting your bottom line.

Maximize Your ROI with WMS

See the long-term benefits with a tailor-made WMS solution that boosts your efficiency and cuts unnecessary costs.

How to Choose the Right Warehouse Management Software for Your Business

Choosing the right warehouse management application or software can be overwhelming, but a structured evaluation approach ensures the selection process stays focused on what truly matters to your business.

Here’s how I recommend CEOs, CFOs, and CTOs approach this decision:

choosing the right WMS

1. Classify Your Warehouse Complexity

Begin by understanding the unique needs and challenges of your warehouse:

  • Order Profile: Are you handling eaches, cases, or pallets? Is your focus on e-commerce or wholesale distribution?
  • SKU Velocity Distribution: Do you have a long tail of low-moving products, or are most of your SKUs fast-moving and concentrated?
  • Constraints: Consider any special requirements, such as temperature zones, hazmat handling, or lot/serial compliance.
  • Labor Reality: Assess turnover rates, training time, and multi-language needs, as these will impact system usability.

2. Decide Your Architecture Posture (Board-Level Choice)

This decision shapes the long-term strategy of your warehouse operations:

  • Cloud WMS: If speed, scalability, and multi-site standardization are your priorities, a cloud-based WMS is usually the best choice. It’s the market trend, offering faster implementation and lower infrastructure costs.
  • ERP-Integrated WMS: If tightly coupling your WMS with ERP systems and unifying master data is critical, go for an ERP-integrated WMS or embedded models (e.g., SAP’s embedded EWM).
  • WMS-Only Mode: If you want to modernize warehouse operations while keeping your ERP stable, consider a WMS-only approach, which Microsoft supports as a strategy for minimizing risk.

3. Integration Strategy (Don’t Wing This)

If you have multiple systems (ERP, OMS, carriers, automation, BI tools), integration should be carefully planned:

  • Canonical Data Model: Create a unified data model that ensures consistency across systems.
  • Event-Driven Updates: Plan for real-time updates (e.g., shipment confirmation, inventory adjustments) that trigger actions across systems.
  • Middleware/iPaaS: Implement middleware or an iPaaS layer to handle data transformations and ensure smooth monitoring and integration between systems.

4. Prove Value with a Pilot That Measures the Right KPIs

Before going live, conduct a pilot to prove the WMS’s value. Focus on KPIs that directly impact your bottom line:

  • Pick Accuracy and Lines per Hour
  • Dock-to-Stock Time
  • Inventory Accuracy Trend
  • Order Cycle Time
  • Exception Rate and Rework Hours

By focusing on these KPIs, you can measure the tangible benefits of your WMS and ensure it delivers the expected improvements in efficiency and cost savings.

A well-planned selection process ensures that the WMS you choose not only fits your current needs but also scales as your business grows.

WMS as a Competitive Advantage

Investing in a Warehouse Management System (WMS) is more than just a software purchase, it’s a strategic move to enhance operational efficiency and gain a competitive edge. If your warehouse plays a critical role in customer experience, margin control, or inventory management, a WMS is undoubtedly worth the investment. However, it’s important to treat it as an operating model upgrade, not just an IT solution.

The macro signals are clear:

  • AI adoption in supply chains is projected to rise to 82% within five years, making data-driven decision-making more crucial than ever.
  • Robotics shipments are expected to grow rapidly, and warehouse automation is accelerating at a pace that demands a seamless WMS for integration and orchestration.
  • RFID, workflow automation, and visibility technologies are key areas of investment for warehouse leaders, aiming to address inventory inaccuracies, stockouts, and labor inefficiencies.

The common denominator across all these trends is the need for a WMS that provides clean execution data and enforces repeatable, efficient processes. A WMS is the backbone that enables your warehouse to leverage emerging technologies, scale operations effectively, and maintain a competitive edge in the market.

By implementing a WMS, you not only optimize core processes, receiving, inventory management, picking, packing, and shipping, but also set the stage for future innovations like AI and automation. The result? Faster, more accurate order fulfillment, improved customer satisfaction, and reduced operating costs.

At AppVerticals, we specialize in custom WMS solutions tailored to your business needs. We ensure seamless integration with your existing systems and processes, allowing your warehouse to operate more efficiently and become a data-driven asset that adds measurable value to your bottom line.

Ready to Cut Down Fulfillment Costs?

See how a custom WMS can reduce labor costs, boost accuracy, and enhance warehouse efficiency.

Outsource Web Development: How to Select a Reliable Web Development Company

To outsource web development strategically, scale delivery, reduce fixed hiring risk, and accelerate product execution by partnering with an external team instead of expanding in-house.

Global hiring timelines for experienced developers often stretch three to six months, depending on market conditions. 

According to the U.S. Bureau of Labor Statistics, the median annual pay for software developers will surpass $151,100 by 2032, excluding recruitment costs, benefits, and overhead. 

That reality is one reason outsourcing web development has moved from a cost-saving tactic to a strategic scaling decision.

Instead of building every capability internally, many organizations now partner with a web development company to design, build, or maintain digital products while preserving internal focus on core priorities.

For many organizations, the question is whether it improves speed, flexibility, and long-term operational efficiency.

Outsourcing Web Development at a Glance 

  • Outsourcing web development is a strategic delivery model that shifts technical execution to external teams while retaining internal product ownership.
  • Companies outsource primarily to improve capital efficiency, access specialized expertise, and accelerate time-to-market without expanding fixed headcount.
  • The three main outsourcing models: Dedicated Team, Fixed Price, and Time & Material, serve different roadmap conditions and governance needs.
  • Risks such as communication gaps, quality drift, and IP exposure can be mitigated through structured oversight and contractual clarity.
  • Outsourcing is not ideal for core R&D or highly sensitive intellectual property initiatives.
  • It becomes strategic when internal hiring cycles slow delivery velocity or when specialized expertise is temporarily required.
  • The right outsourcing partner should offer governance maturity, transparent reporting, and architectural depth.

What Is Outsourcing Web Development?

Outsourcing web development refers to contracting an external engineering team or provider to design, build, and maintain your website or web applications instead of growing the capability entirely in-house. 

According to Future Market Insights, the global web development outsourcing services market was valued at approximately USD 1.6 billion in 2025, with steady projected growth through the next decade, reflecting rising adoption across industries seeking scalable, cost-efficient digital solutions. 

Outsourcing vs In-House vs Staff Augmentation

Choosing between outsourcing, building in-house, or using staff augmentation is not a tactical decision. It directly affects cost structure, hiring velocity, and operational control.

Outsourcing shifts full delivery responsibility to an external partner. Staff augmentation, by contrast, extends your internal team with external developers under your direct management. 

In-house development keeps all engineering capabilities internally, maximizing control but increasing fixed overhead.

Comparison Overview

Model Cost Structure Control Level Hiring Speed Best For
In-House Fixed salaries + benefits + overhead High Slow (months) Core IP, long-term R&D
Outsourcing Project-based or managed team cost Medium Fast Defined projects, scalability
Staff Augmentation Hourly or monthly contractor rates High Moderate Expanding existing teams

In practice, I advise companies to evaluate three variables: budget elasticity, urgency, and IP sensitivity. If speed and flexibility outweigh permanent hiring, outsourcing is efficient. 

If technical leadership and internal continuity are critical, in-house or augmentation may be more appropriate.

Why Do Companies Outsource Web Development?

When I evaluate outsourcing decisions, the drivers almost always come down to three things: economics, capability access, and time-to-market

Cost still matters. Deloitte’s own Global Outsourcing Survey commentary notes that “cost reduction is back on top” as a priority in outsourcing decisions. But in practice, outsourcing has become a capacity and speed strategy as much as a cost strategy.

In competitive markets where digital initiatives directly impact revenue, companies evaluate outsourcing through three lenses: cost structure, capability access, and speed-to-market impact.

Outsourcing web development for business growth - AppVerticals

1. Cost Efficiency & ROI

Outsourcing converts fixed payroll obligations into variable project-based or managed-service costs. Instead of absorbing long-term employment liabilities, companies align engineering spend directly with product timelines.

When structured correctly, outsourcing reduces idle capacity costs and improves budget predictability, particularly for project-based builds or seasonal demand spikes.

2. Access to Specialized Skills

Modern web development isn’t “a developer.” It’s frontend performance, backend APIs, cloud infrastructure, security, CI/CD, and observability. 

Gartner-backed survey reporting highlights how real the capability constraint is: talent shortage was cited as the most significant adoption barrier for 64% of emerging technologies, far ahead of implementation cost (29%) and security risk (7%).

That’s the same reason companies outsource web work: they need specialized skills now, not after a long hiring cycle.

3. Faster Time to Market

Speed is often the decisive factor. According to McKinsey, companies that accelerate digital product launches can outperform peers significantly in revenue growth. 

External development teams reduce ramp-up time because they operate with pre-built workflows, established tooling, and cross-project experience. 

For businesses operating in competitive digital sectors, reducing launch timelines by even a few months can materially impact market positioning.

Risks of Outsourcing Web Development (And How to Mitigate Them)

Outsourcing web development introduces execution leverage, but it also shifts certain operational risks outside your immediate organizational boundary. 

In my experience, the risks are rarely technical, they are structural. The three most common exposure areas are communication breakdowns, inconsistent code governance, and data security misalignment.

According to the Project Management Institute (PMI), poor communication is a primary contributor to project failure in one-third of projects. When delivery teams operate across time zones and cultures, misalignment compounds quickly unless governance is structured intentionally.

The key is not to avoid outsourcing. It is to engineer oversight into the model.

1. Communication & Time Zone Gaps

Distributed teams increase coordination complexity. PMI’s “Pulse of the Profession” reports that ineffective communication remains a leading cause of project underperformance. The mitigation is straightforward but often neglected: define escalation paths, overlap hours for synchronous collaboration, and require documented sprint reporting.

I recommend structured weekly executive summaries in addition to standard standups to reduce interpretation gaps.

2. Code Quality & Governance

External delivery fails when quality standards are assumed rather than enforced. The Consortium for IT Software Quality (CISQ) estimates that poor software quality cost U.S. businesses over $2 trillion annually, largely due to operational failures and technical debt. 

Governance should include code review standards, CI/CD integration visibility, documented architecture decisions, and mandatory testing thresholds. Ownership of repositories must remain with the client organization.

3. IP & Data Security

As per IBM, the global average cost of a data breach reached $4.45 million, the highest on record. When outsourcing involves customer data or proprietary logic, contracts must clearly define IP ownership, access controls, and data handling protocols. 

NDAs alone are insufficient, including role-based access management and audit trails are non-negotiable safeguards.

Types of Web Development Outsourcing Models

Not all outsourcing models are built for the same business objective. The structure you choose affects cost predictability, execution control, and scalability. 

Choosing the wrong commercial structure is one of the most common reasons outsourced projects underperform.

In practice, I evaluate outsourcing models based on three variables: scope clarity, roadmap volatility, and scaling horizon.

Outsourcing web development models - AppVerticals

1. Dedicated Team Model

The dedicated team model embeds an external engineering team that works exclusively on your product over an extended period. This model is most effective when you need sustained development capacity without expanding internal headcount. 

According to Statista, global IT outsourcing revenue exceeded $460 billion in 2023, reflecting growing enterprise reliance on long-term external delivery partnerships. 

Dedicated teams provide continuity, institutional knowledge retention, and predictable velocity, making them ideal for scaling SaaS platforms or multi-year roadmaps.

2. Fixed Price Model

Fixed price outsourcing is best suited for clearly defined projects with stable requirements, such as website rebuilds or limited-scope platform launches. Budget predictability is the main advantage. 

However, the limitation is rigidity. If requirements shift, change orders increase cost and friction. This model performs well when documentation is mature and stakeholder expectations are tightly aligned from the outset.

3. Time & Material Model

Time & material (T&M) outsourcing offers flexibility for evolving product roadmaps. Billing is based on actual hours and resources consumed, making it better suited for agile environments. 

The trade-off is less upfront cost certainty, but significantly lower risk when scope changes frequently. 

For startups or innovation-driven teams, T&M often provides the most operational elasticity.

Model Comparison Overview

Model Cost Structure Flexibility Control Level Best For Primary Risk
Dedicated Team Monthly team fee High High (shared governance) Long-term product scaling Overcommitment if roadmap slows
Fixed Price Pre-defined project cost Low Medium Clearly defined builds Change-order friction
Time & Material Hourly or sprint-based billing Very High High Agile or evolving roadmaps Budget variability

If scope is stable → fixed pricing works.
If roadmap evolves → time & material is safer.
If long-term capacity is needed → dedicated team scales better.

What Web Development Services Can Be Outsourced?

Web development outsourcing is not limited to “building a website.” In practice, companies externalize specific layers of their digital stack depending on internal capability gaps and roadmap priorities. 

According to the U.S. Bureau of Economic Analysis, digital economy activities accounted for over 10% of U.S. GDP in recent reporting, underscoring how central web infrastructure has become to business operations. 

That scale is why organizations selectively outsource high-impact components rather than maintain every capability internally.

The most commonly outsourced web development services include:

  • Frontend Development – UI implementation using frameworks like React, Vue, or Angular, with focus on performance and responsiveness.
  • Backend Engineering – API development, database architecture, authentication systems, and server-side logic.
  • Full-Stack Application Development – End-to-end product builds combining frontend, backend, and infrastructure.
  • CMS & Headless Implementations – WordPress, Drupal, Contentful, or custom headless CMS architectures.
  • E-commerce Platforms – Shopify, Magento, WooCommerce, or custom commerce engines.
  • Cloud & DevOps Integration – Deployment pipelines, CI/CD automation, containerization, and infrastructure optimization.
  • Ongoing Maintenance & Optimization – Security updates, performance tuning, scalability enhancements.

In my experience, companies rarely outsource everything. They outsource where specialization, speed, or scale delivers measurable advantage.

How to Outsource Web Development (Step-by-Step Framework)

Outsourcing fails when companies treat it as vendor procurement instead of structured delivery governance. In my experience, successful outsourcing follows a disciplined evaluation and control model. 

Poorly defined requirements are one of the leading contributors to software project failure. That makes clarity, not cost, the starting point.

Step by Step Outsourcing Web Development Framework - AppVerticals

Here is the framework I use when advising companies:

1. Define Scope and Success Criteria

Document business objectives, user requirements, technical constraints, and measurable outcomes before approaching vendors. Ambiguity increases cost later. Clear documentation reduces rework risk and misalignment.

2. Determine Budget Range and Commercial Model

Establish acceptable cost ranges and decide whether your project aligns with Fixed Price, Dedicated Team, or Time & Material (based on scope stability). Avoid choosing a pricing model before assessing roadmap volatility.

3. Shortlist Vendors Based on Capability, Not Branding

Evaluate technical depth, architecture experience, and governance maturity. Review code samples where possible. According to Harvard Business Review research on outsourcing, vendor selection quality directly correlates with long-term performance outcomes.

4. Conduct Technical and Governance Due Diligence

Assess development methodology (Agile, Scrum), CI/CD practices, security standards, and documentation processes. Request clarity on communication cadence and escalation paths.

5. Establish Legal, IP, and Security Safeguards

Formalize ownership of repositories, intellectual property clauses, and data access controls. The National Institute of Standards and Technology (NIST) emphasizes role-based access management as a fundamental cybersecurity control.

6. Define Milestones and Performance Metrics

Break work into measurable phases with acceptance criteria. Tie payments to deliverables when appropriate. Transparency prevents scope drift.

7. Implement Structured Oversight

Outsourcing does not eliminate accountability, it redistributes it. Maintain regular sprint reviews, technical audits, and performance dashboards. Companies that embed structured governance in digital initiatives significantly improve transformation success rates.

Need Structured Guidance Before You Outsource?

If you’re evaluating outsourcing models, vendor selection, or governance frameworks, clarity upfront can prevent costly misalignment later.

Get a Strategic Consultation

How Much Does It Cost to Outsource Web Development?

The cost of outsourcing web development varies based on geography, expertise level, project complexity, and engagement model.  Average developer rates range from $25–$50 per hour in parts of Asia, $35–$70 in Latin America, and $50–$100+ in Eastern Europe, while North American agencies often exceed $100–$150 per hour

Total project costs can range from $10,000–$25,000 for small marketing sites to $150,000+ for enterprise web platforms, depending on architecture, integrations, and scalability requirements.

Cost, however, should be evaluated through total value.

In my experience, three variables determine real outsourcing cost:

  1. Scope maturity – The clearer the requirements, the lower the change-order risk.
  2. Technical complexity – Custom integrations, APIs, security layers, and cloud infrastructure increase cost.
  3. Engagement model – Dedicated teams offer predictability; Time & Material models offer flexibility.

Average Hourly Rates by Region

Region Typical Hourly Rate (USD)
South & Southeast Asia $25–$50
Latin America $35–$70
Eastern Europe $50–$100+
North America $100–$150+

IT project costs should be evaluated against expected ROI and operational efficiency gains rather than lowest upfront bid. The cheapest vendor often becomes the most expensive if governance and quality controls are weak.

A mature outsourcing strategy balances cost, risk exposure, and delivery reliability. True outsourcing cost is not hourly rate multiplied by hours , it includes coordination overhead, quality assurance maturity, and governance discipline.

When You Should NOT Outsource Web Development

Outsourcing is not universally optimal. In certain scenarios, retaining development in-house is strategically stronger.

According to the U.S. National Science Foundation, businesses fund the majority of U.S. R&D activity, with internal R&D expenditures exceeding $600 billion annually in recent reporting. That investment reflects a core principle: companies protect and internalize work that directly drives proprietary innovation.

You should avoid outsourcing when:

  • The web platform represents core intellectual property or competitive differentiation
  • The product involves sensitive regulated data (e.g., financial, healthcare, defense)
  • Continuous real-time collaboration between product and engineering leadership is required
  • Long-term institutional knowledge retention is critical

In these cases, external execution may introduce governance friction. Outsourcing works best for scalable delivery, not for foundational R&D control.

Signs It’s Time to Outsource

Outsourcing becomes strategic when internal capacity or execution speed begins to constrain growth. According to the U.S. Bureau of Labor Statistics, total job openings in the United States remained above 8 million in recent reporting under the Job Openings and Labor Turnover Survey (JOLTS), reflecting sustained competition for skilled labor. 

When hiring delays slow product timelines, outsourcing shifts from optional to practical.

In my experience, it’s time to outsource when:

  • Product launches are delayed due to engineering bandwidth constraints
  • Hiring cycles exceed acceptable roadmap timelines
  • Specialized expertise (e.g., cloud architecture, performance optimization) is unavailable internally
  • Development demand is temporary or project-based rather than continuous
  • Internal teams are focused on core IP while secondary builds stall
  • Capital efficiency matters more than expanding fixed payroll

Outsourcing is rarely about replacing teams. It’s about protecting momentum when internal scaling lags behind strategic objectives.

Why AppVerticals Is a Leading Partner for Outsourcing Web Development

AppVerticals approaches web development outsourcing as a structured delivery partnership.

Each engagement starts with defined scope, architecture alignment, and sprint governance. You retain product ownership and roadmap control; AppVerticals manages execution velocity through dedicated technical leads, code review standards, QA gates, and transparent milestone reporting.fddf

Delivery is pod-based, not individual-resource based. That means continuity, cross-functional accountability, and reduced dependency risk. Repositories remain client-owned, escalation paths are predefined, and change management is documented, minimizing structural risk before it becomes operational friction.

The result is scalable execution without sacrificing oversight, quality, or strategic control, which is exactly what outsourcing should deliver.

Wrapping it Up

Outsourcing web development is a structural decision about how your organization deploys technical capacity. 

The real question is whether your current model supports speed, scalability, and technical depth without creating fixed-cost drag.

If your roadmap is expanding faster than your hiring pipeline, outsourcing can protect momentum. If your platform defines your intellectual property, internal ownership may be stronger.

In my experience, the best decisions are architectural. The model should match your growth stage, risk tolerance, and long-term strategic control. 

Ready to Outsource Web Development With Confidence?

AppVerticals combines engineering depth with disciplined delivery governance, helping organizations scale execution without losing strategic control.

Start Your Outsourcing Strategy

Related Guides

Angular vs React

Ecommerce web development 

Low-code vs No-code

Website design Cost

Website redesign cost

How to Choose a Mobile App Development Company? A Step-by-Step Guide

When choosing a mobile app development company, the key is to find a partner that not only has the technical expertise but also aligns with your project’s goals and budget constraints. It’s about finding the right balance between experience, reliability, and communication.

As a founder, CTO, or investor, the question isn’t just “Who can build an app?”, it’s how to choose a mobile app development company that won’t blow your budget, miss deadlines, or leave you with a product that’s impossible to maintain post-launch.

I’ve been on both sides of the table, building apps, inheriting half-built ones, and even hiring mobile development teams that seemed perfect on paper, only to have them underdeliver. The tough lesson I learned: A flashy portfolio doesn’t always equate to a reliable development partner.

In this guide, I’ll walk you through how I’d evaluate a mobile app development company today, if I were working with a tight timeline, real stakeholders, and a budget I needed to defend.

Key Takeaways:

  • Define your goals and budget upfront: Be clear about your app’s business outcomes, scope, platform, and constraints to avoid confusion and costly changes down the road.
  • Choose the right engagement model: Fixed-price, Time & Materials, and Dedicated Teams each serve different needs, select the one that best aligns with your project’s uncertainty level and goals.
  • Post-launch support is essential: Budget for ongoing maintenance, security patches, and updates. Maintenance can cost up to 20% of the initial build cost annually.
  • Evaluate a company’s expertise beyond their portfolio: Ask about the problems they solved in past projects, their approach to communication, and how they handle changes during development.
  • Understand the full cost structure: Clarify all potential hidden costs like QA, testing, and third-party integrations before committing to a vendor.
  • Look for long-term partnership potential: A stable, communicative team with a clear product ownership structure will ensure the success of your app both during and after launch.

Core Factors to Consider Before Choosing an App Development Company

Before you even start comparing vendors, you need to get crystal clear on what you’re actually buying. Most bad agency experiences stem from an unclear scope, undefined success metrics, and a budget that’s based more on hope than reality.

So, how do you choose the right mobile app development company? Start with these foundational questions:

  • What business outcome do you expect the app to drive (e.g., revenue, retention, operational efficiency, or risk reduction)?
  • Is this an MVP, a V1, or a full-scale product rebuild?
  • Do you need native performance (e.g., camera functionality, Bluetooth Low Energy (BLE), offline capabilities, animations), or is a cross-platform approach acceptable?
  • What’s your main constraint: time, money, or risk?
Dario Bianchi, Chief Product Officer at MindValley, emphasizes the importance of assessing how a team handles ambiguity, adaptability is key when requirements shift. He also recommends understanding the actual developers who will work on your project, as team turnover during the process can lead to significant issues. Furthermore, it’s crucial to choose a team that challenges your assumptions and doesn’t just build what you ask for, saving valuable resources. Lastly, Dario advocates for teams that operate as Builders, using AI tools to maximize efficiency and deliver end-to-end solutions rather than relying on outdated, siloed approaches.

Here’s a structured outlay of what factors you must consider when choosing a mobile app development company:

how to choose the right app development company

Define Your App’s Goals and Features

I always encourage teams to write goals in clear, simple language. This makes it easier to stay focused on the core objectives:

  • Users can complete checkout in under 60 seconds.
  • Drivers can complete deliveries even with poor connectivity.
  • The app must meet HIPAA/PCI compliance standards (if applicable).

From there, break down these goals into a feature list: Must-have, Should-have, and Nice-to-have. This will help you avoid a common pitfall: adding small features that can silently extend timelines, like admin panels, analytics, role-based access, or offline syncing.

Identify Your Target Audience and Platform (iOS, Android, or Cross-platform)

Choosing the right platform is a strategic decision, not a developer’s personal preference. Here’s a quick rundown of your options:

  • iOS-first often makes sense for markets with higher average revenue per user (ARPU).
  • Android-first might be more important in emerging markets or for reaching a broader audience with diverse devices.
  • Cross-platform (using frameworks like Flutter or React Native) can be an excellent choice if your UX needs are standard and you want to get to market faster.

A key cost consideration: While developers may charge similar hourly rates for both iOS and Android, building separate native apps for each platform can effectively double your effort. So, sharing code thoughtfully is essential for efficiency.

Clarify Your Budget and Timeline Expectations

The most important step is: Define your budget and timeline upfront, and be honest about what you can realistically achieve.

Clutch’s dataset shows the following averages for app development:

  • Average app development cost: $80,000–$100,000
  • Typical timeline: around 11 months
  • Most projects reviewed ranged between $10,000–$50,000 (depending on scope)

In a market where global mobile app downloads have risen from 115 billion in 2021 to an expected 143 billion in 2026 on the Google Play Store (a 30% increase), and the Apple App Store is projected to reach 38 billion downloads (a 15% growth over the same period), it’s crucial to align your project scope with the realities of engineering effort and time required. As the competition grows, it’s not just about building any app, but one that stands out amidst billions of downloads each year.

How to Evaluate a Mobile App Development Company’s Expertise

Choosing the right development partner isn’t just about finding someone with technical skills, it’s about ensuring they can deliver on your project’s unique needs. Evaluating a company’s expertise involves looking beyond the surface.

Here’s how to assess whether a mobile app development company has the right experience and capabilities for your project.

evaluating mobile app development companies

Assess Their Portfolio and Case Studies

Portfolios are important, but I don’t judge them based on how pretty the screens look. Instead, I focus on deeper questions that reveal how well a company truly understands the development process:

  • What problem did the app solve, and what changed after launch?
  • What was the scope of the project (MVP vs. full-fledged enterprise mobile app development)?
  • What constraints did they face (e.g., compliance, offline mode, tight deadlines)?
  • Who owned the product decisions, was it you or the development team?

If they can’t explain the trade-offs they made during the project, it’s a red flag. It likely means they were just executing tickets without fully understanding the strategic and technical nuances.

A quote I always keep in mind when reviewing codebases and vendor outputs is:

“Any fool can write code that a computer can understand. Good programmers write code that humans can understand.” – Martin Flower

Your future team should be able to maintain what they’ve shipped, and their code should reflect that.

Check Reviews and Testimonials

I put more trust in review patterns than the star ratings themselves. Look for recurring themes like:

  • Mentions of “communication,” “predictability,” and “quality”
  • Evidence of how well they handled change requests
  • Positive feedback regarding post-launch support (because, let’s face it, most agencies disappear once the app hits the App Store)
Pro Tip: If you’re using platforms like Clutch to check reviews, make sure the work described aligns with the type of product you’re building, not just a generic label like mobile app development.

 Look for Relevant Industry Experience

Industry experience becomes especially important when your app involves:

  • Regulation (e.g., healthcare, fintech)
  • Complex workflows (e.g., logistics, field operations)
  • Handling sensitive data (e.g., PII, payments)

However, be cautious of agencies claiming to have built 40 apps in your niche without providing concrete proof of outcomes. I’d prefer to hire a team that demonstrates strong architectural discipline and a solid discovery process over one that simply knows the buzzwords of your industry.

Need Expert Guidance?

Book a free consultation with our experts and get personalized advice for your project.


What Should You Look for in an App Development Team?

The success of your app project doesn’t just depend on the development process, it hinges on the strength of the team behind it. When evaluating a potential app development team, consider these key factors:

key factors of a successful app development team

Technical Expertise: Tech Stack and Methodologies (Agile, Waterfall)

It’s essential to ask what they actually ship with, not just what they promise. A strong mobile development agency should be able to explain their approach in detail:

  • Mobile architecture: How do they handle modularity, state management, and app scalability?
  • API strategy: Are they using REST, GraphQL? What’s their versioning and error-handling approach?
  • CI/CD and release process: How do they ensure smooth, automated releases and continuous integration?
  • Testing strategy: What is their approach to unit, integration, and device testing?

On methodology: While many teams claim to follow “Agile,” it’s important to dig deeper. Look for specifics, such as:

  • Sprint cadence
  • Definition of “done”
  • Demo format
  • Backlog ownership

How product decisions are made

A great team should use tools like Agile planning or Scrum boards to stay organized and efficient, ensuring a clear workflow throughout the project.

Communication and Collaboration Skills

This is where projects can either succeed or fail. Good communication is the bedrock of a successful partnership. Here’s what I insist on:

  • One accountable delivery lead: A single point of contact who takes full responsibility for the project’s progress.
  • Weekly demos (not just status meetings): This ensures everyone is aligned, and adjustments can be made quickly.
  • A shared backlog tool (e.g., Jira or Linear): Transparency and organization are key.
  • Written decisions (docs > chats): This helps avoid misunderstandings and ensures decisions are clear and accessible.

One of my favorite leadership principles that resonates with app delivery is:

Any organization that designs a system, will produce a design whose structure is a copy of the organization’s communication structure, says Melvin Conway.

In simple terms: if the development team is fragmented and communication is handoff-heavy, your app will likely end up with the same issues.

Post-launch Support and Maintenance Capabilities

A polished app launch is far from the finish line. To keep things running smoothly and to meet evolving user needs, you need to make sure your team is ready for post-launch support. This includes:

  • Monitoring + crash analytics: To identify and fix issues fast.
  • OS update readiness: Keeping up with new operating system versions.
  • Dependency upgrades: Ensuring libraries and dependencies stay up-to-date.
  • Security patches: Protecting user data and maintaining security standards.
  • Feature iteration: Continuously improving the app based on feedback and new trends.

Don’t forget to budget for maintenance. A general rule of thumb is that annual maintenance costs can be around 20% of the initial development cost.

Looking for Custom App Development?

Let’s discuss your requirements and start building your app.


What Are the Common Mistakes When Choosing a Mobile App Development Company?

In my experience, certain red flags repeatedly pop up, each one costing real money and slowing down projects. Here are the most common mistakes to watch out for:

Relying Too Much on Portfolio Over Reviews

A portfolio alone can be misleading. Sure, a beautiful design looks impressive, but that doesn’t always translate to solid delivery. Relying too much on portfolio reviews can lead you to miss the more important factors:

Ask for references that align with the specific scope and stage of your project. A portfolio may showcase great design, but the real test is how the team handles your specific needs, timeline, and budget.

Ignoring Communication Styles and Project Management Tools

Communication is the backbone of any successful project. If a development team can’t clearly explain:

  • Who runs sprint planning and manages day-to-day tasks
  • Where requirements are documented and tracked
  • How changes in scope are priced and approved

You’re essentially buying chaos. Make sure the team uses structured project management tools like Jira, Linear, or similar platforms that keep things organized and transparent.

Failing to Clarify the Full Cost Structure (Hidden Costs)

A commonly faced problem is not fully understanding the cost breakdown upfront, leading to surprise expenses later on. Some typical hidden costs include:

  • QA and device testing: This often gets overlooked but is crucial for quality.
  • App Store/Play Store iteration time: The approval process can take longer than expected, adding to costs.
  • Analytics instrumentation: Setting up proper analytics and tracking can incur extra charges.
  • Backend hosting and DevOps: Costs for servers, database management, and cloud services can add up.
  • Product discovery: Skipping the discovery phase might save money upfront, but it often leads to costly rework later.

Be sure to clarify every aspect of the cost structure upfront to avoid these surprises.

Not Vetting Security and Data Protection Practices

Security isn’t a feature you can add after the fact, it’s a habit, a core part of the development process. Here are the basic questions I always ask when vetting a potential partner:

  • How do you store secrets (e.g., keys, tokens)?
  • How do you handle Personally Identifiable Information (PII)?
  • Do you conduct threat modeling or basic OWASP checks?
  • Who owns the Apple/Google developer accounts and signing keys?

Failing to consider these aspects can put your app and user data at significant risk.

Expert Reality Check on Deadlines

Dario Bianchi also stressed on some additional points during his conversation, they include:

  • Choosing Based on Portfolio vs. Post-Mortem: It’s essential to ask about a project that failed or nearly failed. The answer will reveal how the team recovered and handled challenges, far more than a polished case study.
  • Cost as the Primary Filter: Focusing only on cheaper rates can lead to costly rework later. Instead, price the outcome, not just the hour. The most expensive app he shipped had the lowest hourly rate.
  • Skipping the “Day 91” Conversation: Everyone talks about launch, but what about three months later when bugs emerge or updates get rejected? If the team can’t clearly outline post-launch support, they might just be a build shop, not a partner.
  • Buying Headcount vs. Capability: Bigger teams can mean more coordination overhead. Dario now favors small squads of Builders, people who blend product thinking, design, and engineering skills, amplified by AI tools. Agencies that aren’t leveraging AI in their daily workflows are already behind.

How to Choose the Right Engagement Model for Your Mobile App Project

Choosing the right engagement model is just as crucial as selecting the right mobile app development company. The model you choose will influence how the project unfolds, how flexible the team is, and how well it aligns with your goals. Here’s a breakdown of the most common engagement models:

Fixed-Price vs. Time and Materials vs. Dedicated Team

  • Fixed-price: This model works best when the project scope is stable and well-defined from the outset. The risk here is that any change requests may become a point of friction and lead to delays or extra costs.
  • Time & materials (T&M): This is ideal for projects where you’re still iterating or refining features—most startups fall into this category. However, it requires strong product ownership from your side, as the team will be charging based on the time and resources spent.
  • Dedicated team: Best suited for long-term projects or when you need deep integration and flexibility. This model provides you with a dedicated group of developers who work closely with you, often acting as an extension of your own team.

Understanding the Flexibility and Scalability of Your Chosen Model

If you’re working with a $500K budget and tight deadlines, here’s what I look for in an engagement model:

  • Scalability: Ensure the team can scale responsibly, this means they should be able to onboard new team members without losing momentum or quality.
  • Parallel Workstreams: Look for a team that can split tasks into parallel streams, such as mobile development, backend, QA, and design. This ensures that work progresses simultaneously rather than waiting for one phase to be completed before moving to the next.
  • Release plan: A clear and phased release plan is crucial. Phased launches (e.g., beta first, then full launch) usually outperform big bang launches where everything goes live at once.

Define Roles and Expectations from the Start (Checklist)

To ensure alignment from day one, use this checklist during your project kickoff:

  • Who is the Product Owner (client vs. vendor)?
  • Who is responsible for writing user stories and acceptance criteria?
  • Who approves designs?
  • What’s the escalation path if things go wrong?
  • What does the release process look like?
  • What’s included in post-launch support?

Teams like AppVerticals, who’ve handled multiple end-to-end launches, often have these mechanics already integrated into their delivery playbooks. This is exactly what you want from a mature and experienced partner.

What Should You Expect in Terms of Costs and Budgeting?

On average, mobile app development costs in between $80,000–$100,000 and takes about 11 months to complete.

First things first: the bulk of your app’s cost will be tied to labor and time-to-ship. Development costs depend largely on the complexity of your app, the region of your development team, and the time required to complete the project. Clutch’s guide is a great resource as it provides typical hourly ranges and project cost bands.

Common Pricing Models in Mobile App Development

There are several pricing models you’ll encounter when working with mobile app development companies:

  • Hourly / Time & Materials (T&M) billing: This model works well when the project scope is still evolving or you’re in the discovery phase. You pay for the hours worked.
  • Milestone-based fixed price: Ideal when the scope is well-defined and the project can be broken down into clear, measurable milestones. You pay a set amount at the completion of each milestone.
  • Monthly retainer: Common for ongoing support and iteration after the initial app launch. You pay a fixed fee each month for continued service.
  • Dedicated team monthly rate: Used when you need a fully dedicated team to work on your project long-term. This model gives you flexibility and ensures the team is integrated with your own processes.

How to Manage Hidden Costs in Mobile App Development

Managing hidden costs is key to staying within budget. Here’s how I tackle this challenge:

  • Require a line-item estimate: This should cover all aspects of the development; design, iOS/Android development, backend, QA, and project management.
  • Document assumptions: Make sure any assumptions (e.g., about project scope, third-party integrations) are written down to avoid misunderstandings later.
  • Implement a change control process: Changes are inevitable, but they should be handled through a formal process that includes a cost estimate and timeline impact.
  • Ensure the “definition of done” is clear: This should include QA, staging, and a release checklist to ensure everything is ready for launch.

Real-life Examples of App Development Pricing (Rates by Region)

Here’s a practical comparison of hourly rates for mobile app development based on region:

Region / Country Typical Hourly Rate (USD) Notes
United States $100–$149 Higher cost, but stronger timezone alignment for US teams
Canada $50–$99 Mid-range pricing
India < $25 Lowest hourly rates, but requires strong processes to avoid rework
Philippines $25–$49 Cost-efficient option
Ukraine $25–$49 Common nearshore/offshore option
Poland $50–$99 Higher end of the Eastern Europe pricing bracket
Mexico $25–$49 Nearshore for US teams
Australia $100–$149 High-cost market, but strong capabilities

Why Post-launch Support Is Critical to Your App’s Success

Many teams underestimate this aspect: the app you launch is the app you’ll be paying for long after the initial release. Post-launch support, updates, and ongoing iterations are crucial to your app’s success and longevity.

App Maintenance and Updates

Once your app is live, you’ll need ongoing work to keep it running smoothly and securely. Here’s what you can expect in terms of maintenance:

  • OS updates (iOS/Android): These are essential to keep your app compatible with the latest operating systems and devices.
  • Dependency upgrades: As libraries and tools evolve, your app’s dependencies will need to be updated to ensure stability and security.
  • Crash fixes: Addressing crashes and bugs quickly is critical to maintaining a positive user experience.
  • Performance improvements: Your app will need periodic updates to improve speed, efficiency, and scalability.
  • Security patches: Regular security updates are crucial to protect user data and prevent vulnerabilities.

A helpful budgeting lens: Maintenance can be a significant annual cost, often ranging around 20% of the initial build cost. This estimate is widely cited in industry reports, such as a Siemens/TimeSeries post referencing CIO.com.

Scalability and Future-proofing Your App

When evaluating potential vendors, it’s important to ask how they plan to handle long-term scalability and flexibility. Here are a few key aspects to consider:

  • Backend scaling strategy: How will the infrastructure handle growing user bases and increasing data loads?
  • Analytics-driven iteration: Does the team use analytics to guide ongoing updates and improvements based on real user behavior?
  • Feature flags: This approach allows you to enable or disable features dynamically, which can help with testing, rollouts, or troubleshooting.
  • Modular code structure: Ensuring your app is built with a modular approach will make future updates and scalability more manageable.
  • Documentation and handover: Clear documentation will ensure that your app can be easily updated or passed off to another team if needed in the future.

Establishing a Long-term Partnership with Your Development Team

The best outcomes I’ve seen often involve a long-term partnership. A successful relationship with your development team looks like this:

  • A stable core team that understands your app’s intricacies and can maintain consistency.
  • Clear product ownership from both parties to ensure priorities are aligned.
  • A predictable release cadence to keep the app evolving and meeting user needs.
  • Quarterly roadmap planning tied to measurable outcomes, ensuring both sides have clear expectations on future goals.

Conclusion 

When choosing a mobile app development company, remember this: you’re not just buying code, you’re investing in decision-making under uncertainty, delivery discipline, and a team that will be with you every step of the way, even after the first production bug hits.

The right partner is more than just a developer, they’re an extension of your team, committed to delivering on time, handling complexity, and ensuring long-term success.

More Related Guides:

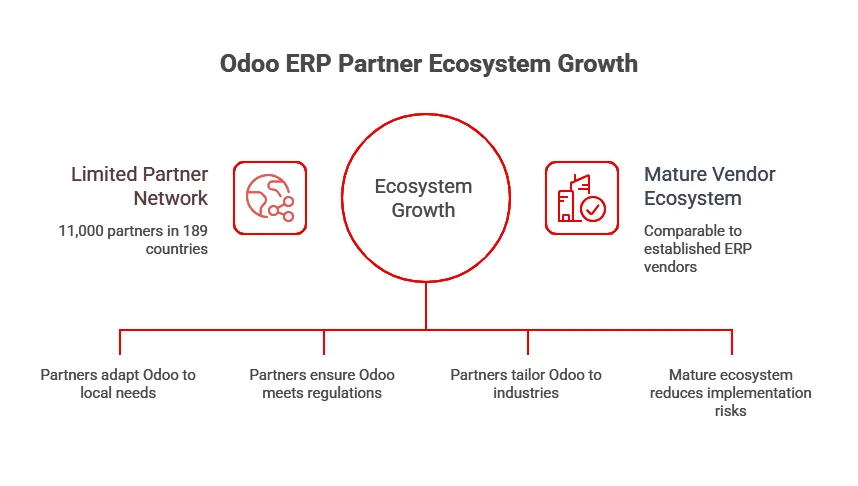
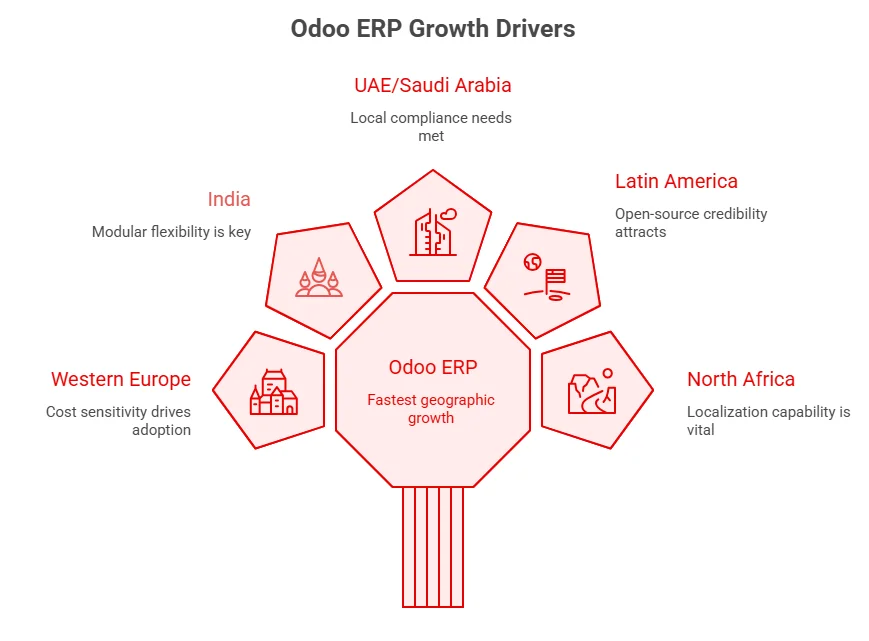
Odoo ERP Market & Adoption Statistics 2026: Growth, Revenue, Users & Industry Trends

In 2026, Odoo ERP powers over 16 million users globally and 170,000+ active enterprises, making it a statistically validated growth engine reshaping the mid-market ERP landscape. For CEOs, CFOs, CTOs, and digital transformation leaders, the question is no longer whether Odoo ERP is viable, but how fast it’s growing, its market share, and its long-term stability.

After a number of Odoo consulting and implementation projects, I’ve learned that successful ERP adoption is not just about software; it’s about operational ROI, scalability, and measurable business growth.

I have compiled this report with the most relevant Odoo ERP market statistics, adoption trends, financial metrics, and industry data for 2026, helping decision-makers interpret the numbers behind the platform’s rise. Without any further ado, let’s dig in.

Key Takeaways | Odoo ERP Market & Adoption Statistics

  • 16+ million users globally and over 170,000 active enterprise customers make Odoo one of the fastest-growing ERP platforms worldwide.
  • 120,000+ new customers annually, growing at ~20–25% CAGR, outperforming SME-focused ERP offerings from SAP, Oracle, and Microsoft Dynamics.
  • Odoo holds 5.77% global ERP market share, and 12–15% of SME ERP adoption, with the strongest presence in Belgium, France, India, Spain, UAE, and Saudi Arabia.
  • According to StartUpBusiness, Revenue is scaling rapidly like a SaaS platform: €650M in 2025, projected to be €800M+ in 2026, targeting €1B by 2027, with 42% annual recurring revenue (ARR).
  • Implementation speed is a major adoption driver: 2–4 months for 10–25 users, 6–12 months for 100+ users, compared to 12–24 months for SAP.
  • Cost advantage is substantial: As per Bresdel, Odoo Enterprise TCO for 50 users: $315K–387K, up to 65% lower than legacy vendors, thanks to flat per-user pricing and no per-module fees.
  • Adoption spans industries with measurable ROI: 25–35% production lead-time reduction in manufacturing, 15% inventory accuracy improvement in retail, 20–30% faster billing cycles in professional services, and 40–60% faster setup in hospitality & real estate.
  • Cloud & AI adoption is high: 60% of core apps are AI-enabled, 35% automated invoice OCR adoption, 20–30% reduction in stock-outs with predictive demand planning.
  • Odoo supports 10,000+ concurrent users, millions of daily transactions, and multi-company, multi-currency reporting, proving its scalability for mid-market enterprises.
  • Despite adoption success, ERP failure risk persists: 75% of projects miss objectives, 74% exceed budget, and 61% run over schedule, usually due to data migration, integration, or governance issues, not the platform itself.
  • For organizations seeking expert guidance on Odoo implementation, AppVerticals delivers proven strategies, customizations, and integrations that maximize ERP ROI.

How Many Users Does Odoo ERP Have Globally in 2026?

Odoo ERP has over 16 million users worldwide in 2026, with 120,000+ new customers added annually.

Total Users Worldwide

As of Q1 2026:

  • 16+ million users globally
  • 756 verified enterprise implementations tracked across industries and geographies
  • Rapid expansion across Europe, North America, LATAM, MENA, and APAC

Odoo is adding approximately:

  • 10,000–11,000 new customers per month
  • 120,000+ new customers annually (run rate)

Growth Trend

Year Estimated Users
2022 7 million
2023 10 million
2024 12 million
2025 13 million
2026 15+ million

5-year CAGR (Compound Annual Growth Rate): ~20–25%

This growth rate significantly outpaces traditional ERP vendors in the SME segment.

What Is Odoo ERP’s Market Share in 2026?

Odoo holds 5.77% of the global ERP market and 12–15% of the SME ERP segment, making it one of the fastest-growing mid-market platforms.

It has the strongest presence in:

  • Belgium
  • France
  • India
  • Spain
  • Middle East emerging markets

Odoo is positioning itself as the dominant modular ERP for mid-market businesses (10–500 employees).

SME Segment Penetration

How Much Revenue Is Odoo ERP Generating and How Fast Is It Growing?

Odoo generated about €650M in revenue in 2025, is projected to exceed €800M in 2026, and is targeting €1B by 2027, reflecting strong ARR growth and SaaS-like scaling.

Revenue Growth Metrics

  • 42% annual recurring revenue (ARR)
  • Valuation exceeding $5 billion

Revenue trajectory:

Year Revenue (Approx.)
2022 €250M
2023 €370M
2024 €426M
2025 €650M
2026 Projected €800M+

Observation: Odoo is scaling like a SaaS company, not a traditional enterprise vendor.

How Is Odoo ERP Being Adopted Across Industries in 2026?

Odoo ERP shows broad adoption across sectors, driving lead‑time reductions in manufacturing, faster checkout and inventory gains in retail, optimized services billing, and quicker setup in hospitality and real estate.

Industry Distribution

Odoo ERP adoption spans multiple verticals:

1. Manufacturing

  • 25–35% production lead-time reduction reported
  • 40% improvement in MRP accuracy

2. Retail & eCommerce

  • 113,000+ online stores powered by Odoo
  • 20–30% faster POS checkout processing
  • 15% inventory accuracy improvement

3. Distribution & Wholesale

  • Multi-warehouse routing optimization
  • Automated procurement triggers

4. Professional Services

  • 20–30% faster billing cycles
  • Improved project margin tracking

5. Hospitality & Real Estate

  • Pre-configured industry modules reduce setup time by 40–60%

Odoo 19 now includes 100+ industry-specific packages, accelerating time-to-value.

Odoo ERP Cost & TCO Statistics (2026)

Cost remains a major differentiator.

Subscription Pricing Benchmarks

Enterprise Edition:

  • $24 per user/month (standard markets)
  • Regional price adjustments up to ~$70/user/month in select territories

Community Edition:

  • Free (open-source)
  • Self-hosted
  • No official support

5-Year Total Cost of Ownership (50 Users)

ERP System 5-Year Total Cost of Ownership (TCO)
Odoo Enterprise ~$315,000–387,000
SAP Business One $750K–$1.2M
Oracle NetSuite $500K–$900K
Microsoft Dynamics 365 $600K–$1.1M

Odoo delivers up to 65% lower TCO compared to legacy ERP vendors.

Savings stem from:

  • No per-module licensing fees
  • Flat per-user pricing
  • Automated upgrades
  • No forced enterprise bundles

What Are Odoo ERP’s SME Adoption Statistics in 2026?

In 2026, about 78% of SMEs are adopting or implementing ERP systems, and Odoo holds the fastest growth rate among SME‑focused ERP platforms.

ROI Timeline

  • Break-even: 11–18 months
  • Labor cost reduction: 15–25%
  • Manual process reduction: up to 40%
  • Inventory carrying cost reduction: 10–20%

ROI Timeline

For mid-market companies, Odoo ERP adoption is often justified within the first fiscal year.

How Has the Odoo ERP Partner Ecosystem Grown in 2026?

Odoo’s global partner network exceeds 11,000 certified partners in 189 countries, supporting localization, industry‑specific implementation, and broader ecosystem maturity.

Ecosystem growth supports:

  • Localization
  • Compliance adaptation
  • Industry-specific implementation
  • Lower deployment risk

Vendor ecosystem maturity is now comparable to established ERP vendors.

Odoo ERP Partner Ecosystem Growth

How is Odoo ERP Leveraging Cloud and AI in 2026?

Odoo ERP leverages cloud deployment and AI to automate processes, improve forecasting, and scale efficiently, making it a proactive platform for SMEs.

Expert Opinion:
I see Odoo continuing to grow in the SME market, with more AI features and ecosystem expansion in the coming years.
– Omar Farh, Odoo Developer

AI-Driven Features & Cloud Adoption in Odoo ERP

As of 2026:

  • AI is embedded in 60% of core
  • Automated invoice OCR adoption rising 35%
  • Predictive sales forecasting integrated
  • Demand planning models reduce stock-outs by 20–30

Cloud deployment trends:

  • The majority of new customers are choosing SaaS
  • Multi-database replication
  • Scalable beyond 10,000 concurrent users

This indicates that Odoo ERP is no longer “just open-source,” it is AI-augmented and cloud-native.

Expert Opinion:
The “composable ERP” trend – Businesses are moving away from monolithic systems toward modular platforms. Odoo’s app-based architecture fits perfectly with this shift, letting companies build their tech stack incrementally rather than committing to massive upfront investments. Economic pressures are accelerating the shift – With the current economic climate, CFOs are scrutinizing every software expense. Companies are actively looking to consolidate their tech stack, and Odoo can replace 5-10 different SaaS subscriptions at a fraction of the cost. The SMB market maturation – Mid-market companies that outgrew QuickBooks but aren’t ready for SAP now have viable options. Odoo has really matured in recent years – better UX, more robust features, stronger partner ecosystem. It’s no longer just for small shops. Developer community momentum – There’s a growing pool of Odoo developers and implementation partners globally, particularly in regions like India, Europe, and Latin America. This makes implementation more accessible and competitive pricing-wise.
– Jihad Mahfouz, Full Stack Developer

Where Is Odoo ERP Experiencing the Most Geographic Growth in 2026?

Odoo ERP is growing fastest in regions like Western Europe, India, the UAE & Saudi Arabia, Latin America, and North Africa, driven by cost sensitivity, modular flexibility, and local compliance needs.

Emerging markets show the fastest acceleration due to:

  • Cost sensitivity
  • Modular flexibility
  • Open-source credibility
  • Localization capability

Odoo Geographic Growth

How Does Odoo ERP Compare Competitively in the Market in 2026?

Odoo competes strongly on cost, speed, modularity, and flexibility versus legacy vendors like SAP, Oracle, and NetSuite, making it especially appealing for mid‑market and SME deployments

Category Odoo SAP Oracle NetSuite
User Experience Highly intuitive and user-friendly Complex and requires training Moderately user-friendly Fairly easy with some learning curve
Cost Structure Budget-friendly and scalable Premium-priced solution High-cost enterprise pricing Mid-to-upper pricing range
Flexibility & Customization Extremely adaptable with extensive customization options Limited flexibility Moderate customization capabilities Restricted customization compared to others
Ideal For Organizations of all sizes, from startups to large enterprises Large-scale corporations Multinational firms with complex HR and operations needs Growing mid-market companies seeking a cloud-based ERP

How Scalable Is Odoo ERP in 2026?

Performance metrics:

  • 10,000+ concurrent users supported
  • Millions of daily transactions are possible
  • Multi-company, multi-currency environments
  • Consolidated reporting across global entities

Scalability is no longer a barrier for mid-market enterprises.

What Challenges and Market Constraints Does Odoo ERP Face?

Despite strong statistics, Odoo ERP has limitations:

  • Steeper learning curve vs accounting-only systems
  • Customization maintenance overhead
  • Not ideal for extremely regulated industries
  • Large enterprise (10,000+ users) complexity may require additional architecture

However, adoption trends show these constraints are not slowing mid-market growth.

Why Do Some Odoo ERP Implementations Fail?

Despite its rapid adoption, a significant number of Odoo ERP implementations run into serious issues that can undermine expected ROI and delay go-live dates.

Up to 75% of ERP projects fail to achieve original objectives, with only about 23% considered fully successful, while 74% exceed budget and over 61% take longer than planned. This high failure rate reflects integration, scope, and planning issues that plague many Odoo deployments.

One of the most common implementation failure causes remains poor data migration. Migrating data from legacy systems to Odoo often results in incomplete maps, corrupt records, and lost history when not properly audited and cleansed beforehand, increasing the likelihood of post-go-live disruptions.

Key Implementation Failure Trends to Watch in 2026

  • Integration risk remains a top threat: as ERP ecosystems expand, projects require more real-time data syncs and API connections between Odoo and legacy or third-party systems, failures in which account for a large share of overruns in cost, time, and scope.
  • Customization debt is increasing: firms trying to replicate legacy processes instead of re-engineering workflows in Odoo risk prolonged upgrade cycles and escalating maintenance bills.
  • Training and adoption gaps continue to derail otherwise functional implementations, especially in self-implemented or under-managed projects.
  • Data quality and migration complexity remain core risk vectors, emphasizing the need for phased dry runs and extensive cleansing prior to go-live.

Key Implementation Failure Trends to Watch in 2026

Failure Red Flags Every Buyer Should Monitor in 2026

To avoid becoming another statistic, stakeholders should watch for:

  • No detailed scope or KPI documentation before project kickoff
  • Frequent scope changes during build without change control
  • Low user participation in testing (lack of UAT)
  • No dedicated change management plan
  • Integration delays that push go-live phases outward

These are consistent risk patterns across multiple Odoo implementation mistake analyses, reinforcing that failure is rarely due to the ERP itself, but due to project governance failures.

Odoo Looks Simple—Until You Implement It

Don’t become part of the 75% ERP failure statistic. AppVerticals delivers risk-controlled Odoo implementations built for measurable ROI.

Discover Odoo ERP

Key Odoo ERP Adoption Trends in 2026

  • Trend 1: Modular ERP Over Monolithic Systems: Businesses prefer incremental activation over massive upfront purchases.
  • Trend 2: Cost Transparency Driving Decisions: Flat pricing models outperform tiered enterprise licensing.
  • Trend 3: AI-Embedded ERP Systems: Automation is becoming baseline, not premium.
  • Trend 4: Emerging Market Acceleration: Odoo dominates cost-sensitive digital transformation markets.
  • Trend 5: Shift from On-Premise to SaaS: Cloud-first deployments are now the majority.
Expert Opinion:
Odoo has emerged as one of the fastest-growing ERP platforms in recent years, driven by its ability to deliver a comprehensive and flexible solution at a competitive cost. It positions itself effectively between complex, high-cost legacy systems and lightweight tools with limited functionality, making it particularly attractive for growing businesses. With continued expansion in cloud capabilities and automation features, Odoo appears well-positioned to strengthen its global market presence in the coming years.
– Amr Abuzeid, Sr. Odoo Functional Consultant

Final Analysis: What the Statistics Signal

The 2026 data confirms Odoo ERP has transformed from a niche open-source option to a high-growth, globally adopted, financially robust ERP platform. Key stats highlight:

  • User Base & Market Growth: 16+ million users, 170,000+ enterprise customers, 120,000+ new clients annually, and CAGR ~20–25%.
  • Revenue & Financial Strength: €650M in 2025, projected €800M+ in 2026, ARR at 42%, targeting €1B by 2027. Valuation exceeds $5B, signaling stability and reinvestment capacity.
  • Market Positioning: 5.77% global ERP market share, 12–15% SME segment adoption, competing against 250+ ERP vendors. Dominates modular, cloud-first, AI-embedded ERP adoption for mid-market enterprises.
  • Operational ROI: Break-even within 11–18 months, 15–25% labor cost reduction, up to 40% manual process reduction, 10–20% lower inventory carrying costs.
  • Implementation Efficiency: Average deployment of 2–12 months depending on company size, 89% report <48 hours downtime, 92% rate migration “smooth” or “very smooth”.
  • Cost & TCO Advantage: Up to 65% lower 5-year TCO than SAP, Oracle, or Microsoft Dynamics. Flat per-user pricing, automated upgrades, and no forced bundles drive affordability.
  • Cloud & AI Adoption: 60% of apps are AI-enabled, automated invoice OCR adoption up 35%, predictive sales & demand planning reducing stock-outs 20–30%.
  • Global Expansion: Strongest growth in Western Europe, India, UAE, Saudi Arabia, Latin America, and North Africa, driven by modular flexibility, cost sensitivity, and local compliance.

Odoo ERP’s modularity, cost-effectiveness, speed, and AI/cloud features make it a top choice for SMEs and mid-market companies. Its growth signals vendor stability, a mature ecosystem, and proven ROI, making the real question how quickly it can boost operational efficiency.

More Related Guides:

Angular vs React: Which Framework Is Better for Scalable Web Applications?

Angular vs React is a strategic decision that affects scalability, hiring, and long-term maintainability. 

 Whether you’re building in-house or working with a web development company, the framework you choose will influence architecture, governance, and long-term technical risk. 

According to Stack Overflow, React remains the most widely used web framework among professional developers, reflecting its broad ecosystem and talent availability. 

Angular, backed by Google, continues to be widely adopted in enterprise environments that prioritize structured architecture and TypeScript-first development. 

Both can power large-scale applications, but their architectural philosophies differ. This guide compares React and Angular specifically through the lens of scalable web applications.

React vs Angular: Quick Comparison Summary

Evaluation Area React Angular
Core Type UI Library Full Framework
Maintained By Meta Google
Architecture Style Flexible, unopinionated Opinionated, structured
Language JavaScript / Optional TypeScript TypeScript-first
Learning Curve Moderate Steeper
Built-in Tooling Minimal (choose ecosystem tools) Integrated routing, DI, forms
Startup Fit Strong (fast iteration) Moderate
Enterprise Fit Strong with governance Very Strong by default
Hiring Pool Broader global adoption More enterprise-aligned
Scalability Ceiling High (architecture-driven) High (architecture-driven)
Technical Debt Risk Depends on internal discipline Depends on structural complexity
Best For Flexible SaaS, rapid MVPs Large teams, structured environments

What Is the Core Difference Between Angular and React?

Angular and React both power modern web applications, but they differ fundamentally in philosophy, structure, and ecosystem design. React is a UI-focused library that prioritizes flexibility and composability, while Angular is a full-featured framework that provides built-in architectural patterns and tooling. 

Understanding this distinction is critical when evaluating scalability, team coordination, and long-term maintainability.

What is React?

React is a JavaScript library focused specifically on building user interfaces through reusable, component-based architecture. It gives developers flexibility to choose routing, state management, and tooling based on project needs.

React is maintained by Meta and has one of the largest frontend ecosystems globally. React has over 220,000+ GitHub stars, reflecting strong community adoption and ecosystem maturity.

Because React is unopinionated about application structure, teams must define architectural conventions themselves. This flexibility accelerates development but requires disciplined engineering standards as projects scale.

What is Angular?

Angular is a full-fledged frontend framework developed and maintained by Google. Unlike React, it provides built-in solutions for routing, dependency injection, form handling, HTTP services, and state management patterns.

Angular is written in and strongly integrated with TypeScript, which aligns with broader enterprise development trends. 

According to the State of JavaScript, TypeScript usage continues to grow across professional teams, reinforcing Angular’s enterprise positioning.

Angular’s opinionated architecture enforces structure by default. This can reduce ambiguity in large development teams but may introduce additional complexity for smaller projects.

Structural Comparison Table

Evaluation Factor React Angular
Type UI Library Full Framework
Maintained By Meta Google
GitHub Stars (2024) 220K+ 95K+
Architecture Style Flexible Opinionated
Language JavaScript / TypeScript TypeScript-first
Built-in Tooling Minimal Extensive (routing, DI, forms)
Learning Curve Moderate Steeper
Ecosystem Size Very Large Large
Team Standardization Requires internal conventions Enforced by framework
Enterprise Alignment High Very High

Which Framework Scales Better?

Both Angular and React scale effectively for large web applications when the underlying architecture is well designed. 

I don’t consider one inherently more scalable than the other, performance at scale depends more on state management, code organization, and backend infrastructure than on the framework itself.

React gives teams architectural flexibility, which can scale extremely well with disciplined engineering practices. Angular enforces structure by default, which can make large team coordination more predictable.

If scalability is the only concern, either framework can support high-growth applications, the deciding factor is how your team manages complexity as the product evolves.

What Determines Scalability: Framework or Architecture?

Scalability is driven more by architecture and performance discipline than by whether you pick React or Angular. On today’s web, the biggest scalability killers are usually payload size, rendering strategy, and backend/API efficiency, not the framework label.

The median desktop page ships ~708 KB of JavaScript, showing how quickly performance can degrade if you don’t control bundles, code splitting, and loading strategy.

Real-user performance improvements also show measurable business impact: Rakuten 24 reported that a “good” LCP was associated with a 61.13% conversion rate increase (measured using real-user Web Vitals). 

So, treat React vs Angular as a team/process and architecture choice: state management, module boundaries, lazy loading, caching/CDN, and API performance determine whether your app scales cleanly.

Can Angular and React Handle 100K to 1M Users?

Both React and Angular are capable of supporting high-traffic applications, including performance-sensitive use cases like ecommerce web development

The real performance constraints at scale typically come from JavaScript execution cost, bundle size, rendering strategy, and backend infrastructure, not from the framework label itself.

The median JavaScript execution time on mobile is over 3.5 seconds for the 75th percentile of sites. This shows that client-side performance bottlenecks are often tied to script weight and optimization strategy rather than framework choice.

Under 100K Users: Does Framework Choice Really Matter?

At this stage, framework differences are rarely the bottleneck.

  • Network latency and API design usually dominate performance concerns
  • Database queries and backend response time have greater impact
  • Frontend rendering overhead is typically manageable

According to Google’s Core Web Vitals documentation, user experience degradation is more strongly correlated with rendering delays and resource loading strategy than with specific frontend frameworks.

Verdict: Under 100K users, framework choice has minimal impact on scalability if basic performance practices are followed.

Between 100K and 500K Users: What Starts to Break?

In growth-stage applications, architectural quality begins to matter more.

At this scale:

  • State management complexity increases
  • Component re-render frequency becomes measurable
  • Bundle size optimization becomes critical
  • Code splitting and lazy loading directly affect interaction speed

The Chrome team has consistently emphasized that excessive JavaScript execution blocks the main thread, impacting Time to Interactive.

This reinforces that architectural decisions, not React vs Angular, determine responsiveness at scale.

Insight: Between 100K and 500K users, performance depends more on disciplined state management and rendering optimization than on the framework itself.

Beyond 500K Users: What Really Determines Scalability?

At enterprise scale, governance and code discipline dominate performance outcomes.

Large-scale systems typically face:

  • Multi-team code contributions
  • Increased dependency complexity
  • Versioning and upgrade management challenges
  • Strict performance budgets

According to the Web.dev, maintaining performance budgets and controlling bundle growth are essential as applications grow in complexity .

At this stage:

  • Angular’s enforced structure can improve coordination in large teams
  • React’s flexibility requires strong internal architectural standards
  • Backend scalability, caching layers, and CDN strategy become more critical than frontend framework choice

Which Framework Is Better for Large Development Teams?

When applications grow, team complexity often becomes a bigger challenge than technical performance. At scale, the question shifts from “Can the framework handle traffic?” to “Can multiple teams maintain and evolve this codebase efficiently?”

According to the DORA, high-performing engineering organizations are 2.6× more likely to have well-defined architectural standards and clear ownership boundaries. Governance, not tooling alone, drives sustainable scaling.

React in Large Teams

React offers architectural flexibility. This allows teams to design systems tailored to product needs, but it also requires:

  • Internal coding standards
  • Agreed state management patterns
  • Clear module boundaries
  • Strong code review processes

Without internal governance, React projects can diverge structurally across teams. With discipline, however, React scales effectively across distributed organizations.

Angular in Large Teams

Angular enforces structure through its module system, dependency injection, and opinionated patterns. This reduces decision fatigue and can standardize development practices across teams.

According to JetBrains, TypeScript is used by over 70% of frontend developers. Angular’s TypeScript-first design aligns closely with enterprise environments that prioritize static typing and consistency.

Tradeoff Summary

  • Smaller, fast-moving teams may benefit from React’s flexibility.
  • Larger, multi-team organizations may benefit from Angular’s built-in structure.
  • Governance maturity matters more than framework choice.

In practice: For large teams, Angular reduces structural ambiguity by default. React requires stronger internal standards, but scales equally well when those standards are enforced.

Which Should You Choose: Angular or React for Startups, Enterprise, and Scaling SaaS?

The Angular or React decision becomes much clearer when you stop thinking about features and start thinking about constraints. Startups optimize for speed and flexibility. Enterprises optimize for governance and predictability. Both frameworks scale, but they reduce friction in different environments.

According to CB Insights, 38% of startups fail because they run out of cash. That reality forces early-stage teams to prioritize speed, hiring flexibility, and reduced engineering overhead over architectural rigidity.

At the enterprise level, the constraint shifts. McKinsey’s research shows that organizations with standardized technology governance are more likely to succeed in digital transformation initiatives. Structure becomes an asset at scale.

The framework I choose depends on which constraint dominates.

For Startups & MVPs

When I evaluate frameworks for startups or MVP-stage products, I focus on three things: hiring speed, iteration velocity, and flexibility.

React’s ecosystem is significantly larger, which reduces hiring friction. React has broader professional adoption than Angular, making it easier to recruit from a wider talent pool.

More importantly, React does not enforce architectural decisions early. That flexibility allows startups to pivot, experiment with state management solutions, and adjust project structure as the product evolves. In early stages, that freedom often outweighs the benefits of strict structure.

That said, flexibility comes with responsibility. Without internal discipline, React codebases can become inconsistent as teams grow.

My verdict for startups:
If speed, experimentation, and hiring flexibility are critical, I lean toward React.

For Enterprise Applications

In enterprise environments, my evaluation criteria change. I care more about governance, cross-team alignment, and long-term maintainability than rapid experimentation.

Angular’s opinionated structure reduces architectural ambiguity. Built-in dependency injection, routing, and modular patterns create consistency across teams. That consistency becomes valuable when multiple squads contribute to the same product.

The State of Agile highlights that alignment and standardized practices significantly influence delivery performance in large organizations. Frameworks that enforce conventions can support that alignment.

Angular’s TypeScript-first design also supports stricter typing and clearer contracts between modules, which I’ve seen reduce onboarding friction in structured enterprise teams.

My verdict for enterprise:
If I’m managing multiple teams and need architectural consistency at scale, Angular reduces coordination risk.

For SaaS Products Expecting 100K+ Users

Growth-stage SaaS products sit in the middle. They need startup-level velocity and enterprise-level discipline.

At this stage, I evaluate:

  • Team growth trajectory
  • Feature release frequency
  • Performance sensitivity
  • Governance maturity

If the team is small but scaling quickly, React’s flexibility supports rapid UI evolution. If the organization already operates with defined architectural standards and expects multiple parallel teams, Angular’s structure can prevent long-term fragmentation.

Here’s how I typically frame it:

Mini Decision Matrix for Scaling SaaS

If My SaaS Prioritizes… I Lean Toward
Rapid feature iteration React
Strict architectural standards Angular
Broad hiring pool React
Enterprise client compliance Angular
Strong internal engineering governance Either works

My SaaS insight:
Beyond 100K users, the bigger risk is complexity. The framework should match the maturity of the team managing that complexity.

Still Deciding Between React and Angular?

We help startups and enterprises choose the right frontend architecture based on scalability goals, team structure, and long-term maintenance strategy.

Get a Free Consultation

What Is the Development Cost and Total Cost of Ownership for React vs Angular?

While evaluating React vs Angular from a cost perspective, look at total cost of ownership (TCO), which includes hiring, onboarding, architectural risk, maintenance overhead, and long-term refactoring cost.

This is why mature web app development services evaluate frontend framework decisions not just on build cost, but on long-term maintainability and governance impact.

Upfront development cost differences between React and Angular are usually marginal. The bigger financial impact comes from talent availability and productivity. 

According to the U.S. Bureau of Labor Statistics, employment of software developers is projected to grow 25% from 2022 to 2032, significantly faster than average. In a growing talent market, access to a larger developer pool directly affects hiring speed and salary pressure.

Initial Development Cost

From what I’ve observed:

  • React may reduce early-stage setup time because teams can start small and assemble tools as needed.
  • Angular may require more upfront structure and onboarding due to its opinionated architecture and TypeScript rigor.

However, this difference rarely determines the overall project budget. Architecture discipline matters more than framework selection.

Hiring & Talent Market Impact

Hiring is often the hidden cost driver.

React’s broader ecosystem and adoption typically provide a larger candidate pool globally. A wider hiring base can reduce recruitment timelines and mitigate salary inflation in competitive markets.

Angular talent often aligns with enterprise environments and TypeScript-heavy stacks. In structured organizations, that specialization can increase productivity consistency, even if the hiring pool is slightly narrower.

Hiring friction and onboarding time often influence cost more than framework complexity itself.

Maintenance & Long-Term Cost

Long-term maintenance is where cost divergence can occur.

If React projects lack architectural standards, refactoring and inconsistency can increase future maintenance overhead. Conversely, Angular’s enforced structure can reduce ambiguity but may introduce upgrade and dependency management complexity over time.

The longer teams spend resolving architectural inconsistencies, the higher the indirect cost.

From a TCO perspective, I focus on:

  • Codebase consistency
  • Onboarding speed
  • Refactor frequency
  • Upgrade complexity
  • Team governance maturity

So, Which Is More Cost-Effective: React or Angular?

In my experience, neither React nor Angular is inherently cheaper.

  • React may lower early hiring friction and improve iteration speed.
  • Angular may reduce long-term coordination cost in structured, multi-team environments.

The framework that aligns better with your team structure and governance maturity will ultimately be the more cost-effective choice.

React vs Angular Cost Breakdown

Cost Factor React Angular Long-Term Cost Impact
Initial Setup Time Faster to start, flexible tooling Structured setup, more configuration upfront Minor impact overall
Hiring Availability Broader global talent pool Strong enterprise-focused pool Hiring friction affects timeline
Onboarding Speed Depends on internal standards Faster in structured teams Governance maturity critical
Architectural Risk Higher if standards are weak Lower ambiguity by default Impacts refactoring cost
Refactor Frequency Higher in loosely governed teams Moderate if over-structured Influences maintenance budget
Upgrade Complexity Ecosystem-driven dependencies Framework-driven version upgrades Can affect long-term stability
Multi-Team Coordination Cost Requires internal conventions Built-in structural guidance Impacts scaling efficiency

Final cost principle:
The most expensive framework is the one that doesn’t match your organizational discipline.

Which Framework Reduces Technical Debt?

When evaluating React vs Angular for long-term sustainability, focus less on features and more on technical debt risk. At scale, technical debt rarely comes from the framework itself, it comes from inconsistent patterns, rushed decisions, and weak architectural governance.

React and Technical Debt Risk

React’s flexibility is both its strength and its risk. Because React does not enforce architectural patterns by default, teams must define:

  • State management standards
  • Folder structures
  • Component boundaries
  • Data flow conventions

In disciplined teams, this flexibility enables clean, modular systems. In loosely governed teams, it can create fragmentation and refactoring cost as the codebase grows.

In my experience, React does not create technical debt, lack of architectural standards does.

Angular and Technical Debt Risk

Angular enforces structure through modules, dependency injection, and opinionated patterns. That structure can reduce architectural ambiguity early in the lifecycle.

However, enforced structure does not eliminate debt. It shifts the risk.

Angular applications can accumulate complexity through:

  • Overly rigid module hierarchies
  • Heavy dependency chains
  • Upgrade friction across major versions

Structure helps, but governance still determines long-term maintainability.

Long-Term Risk Tradeoff

From a risk perspective:

  • React increases risk if governance is weak.
  • Angular increases risk if teams resist its architectural discipline or over-engineer solutions.

In both cases, technical debt compounds when teams move fast without clear architectural boundaries.

My conclusion:

Neither framework inherently reduces technical debt. The lower-risk option is the one that aligns with your team’s discipline, review processes, and long-term architectural strategy.

Which Is Easier to Hire For: React or Angular?

When evaluating React vs Angular from a hiring perspective, focus on three factors: talent availability, onboarding speed, and long-term recruitment sustainability

Framework popularity alone doesn’t determine hiring ease, like supply, demand, and specialization patterns do.

According to GitHub, JavaScript remains the most widely used programming language on GitHub, with TypeScript ranking among the fastest-growing languages globally. 

This matters because React primarily operates within the broader JavaScript ecosystem, while Angular is deeply integrated with TypeScript.

React Hiring Reality

React’s ecosystem benefits from JavaScript’s dominant market position. Because JavaScript is the foundation of modern frontend development, the React talent pool is generally broader across regions.

The Indeed Hiring Lab has consistently reported high job posting volumes for React-related roles compared to Angular in major tech markets. Higher job demand typically correlates with larger available talent pools, but also increased competition.

In practice, I’ve found React roles attract more applicants, especially in startup and SaaS environments.

Angular Hiring Reality

Angular tends to be more concentrated in enterprise and corporate environments. Because Angular is TypeScript-first and more opinionated, it often attracts developers comfortable with structured, framework-driven development.

The rise of TypeScript adoption strengthens Angular’s positioning. That aligns well with Angular’s enterprise use cases.

However, Angular’s talent pool may be more specialized compared to React’s broader JavaScript-driven ecosystem.

Market-Driven Insight

From a hiring perspective:

  • React typically offers a broader global talent pool.
  • Angular may provide more standardized, enterprise-aligned developers.
  • Salary differences are usually influenced more by seniority and region than by framework alone.

Note!

If hiring speed and candidate volume are critical, React often provides more flexibility. If you need developers aligned with structured, enterprise-grade patterns, Angular may offer stronger consistency.

How to Choose Between React and Angular (Decision Checklist)

Don’t start with popularity. Start with constraints. The right decision depends on team size, governance maturity, hiring reality, and product velocity.

Both React and Angular are mature, production-proven technologies. React ranks among the most desired web technologies, while Angular maintains strong usage in structured enterprise environments. Popularity alone, however, should not drive architecture decisions.

Angular vs React - How to choose the best-suited?

Here’s the checklist I use when making the call.

Choose React If…

I lean toward React when:

  • I need rapid UI iteration and experimentation
  • My team is small or scaling quickly
  • Hiring flexibility is a priority
  • I want architectural freedom to tailor solutions
  • My product roadmap may pivot frequently
  • I prefer assembling best-of-breed tooling
  • I have strong internal engineering discipline

React aligns well with startup velocity and SaaS environments that prioritize speed.

That ecosystem strength often translates into community support, tooling variety, and faster problem resolution.

My rule: If flexibility and hiring breadth matter more than enforced structure, React is usually the better fit.

Choose Angular If…

I lean toward Angular when:

  • I manage multiple development teams 
  • I require standardized architectural patterns 
  • Governance and consistency are critical 
  • My organization values strict typing and structured modules 
  • Long-term maintainability outweighs rapid experimentation 
  • I want built-in solutions for routing, forms, and dependency injection 

Angular’s opinionated design reduces ambiguity across large teams. 

Angular’s TypeScript-first architecture aligns well with enterprise engineering practices focused on static typing and contract enforcement. 

My rule: If structural consistency and cross-team coordination are your primary concerns, Angular often reduces long-term governance risk. 

Final Decision Insight

When I strip away brand preference and community hype, the conclusion is consistent:

  • React optimizes for flexibility and velocity.
  • Angular optimizes for structure and governance.
  • Neither framework inherently scales better, teams do.

The correct choice is the one that matches your organizational discipline and growth trajectory.

How AppVerticals Engineers Scalable React and Angular Applications

At AppVerticals, React and Angular decisions are evaluated through scalability modeling, governance maturity, and long-term maintainability risk. 

They have implemented both frameworks in production environments serving high-growth SaaS platforms, performance-sensitive ecommerce systems, and enterprise-grade web applications.

Their approach begins with architectural boundaries: state management strategy, modular isolation, performance budgets, and infrastructure alignment. Framework selection is made only after analyzing projected user growth, team expansion plans, and compliance requirements.

Wrapping it Up

React and Angular are both capable of powering scalable web applications, the difference lies in how they shape team coordination, architectural discipline, and long-term growth. 

React offers flexibility and hiring breadth, while Angular provides built-in structure and governance clarity. The right choice aligns with your product stage, organizational maturity, and long-term engineering strategy.

Planning a Scalable Web Application with React or Angular?

Get a technical roadmap tailored to your growth stage, from MVP validation to enterprise-grade architecture.

Talk to a Frontend Architect

Related Guides

ecommerce web development 

web redesign cost 

LMS implementation

Outsource web development

Low-code vs No-code

Website design Cost

Real Estate website development

How Much Does Software Development Cost In 2026? A Complete Estimation Guide

A sobering 68% of software projects exceed their budget, according to the Standish Group’s CHAOS Report. For founders and CTOs, inaccurate cost estimates lead to financial overruns, failed launches, and long-term setbacks.

If you’re wondering how much does it cost to develop a software, it lies between $40,000 for basic solutions to $500,000+ for enterprise-level solutions.

However, modern software projects are complex, involving variables like team composition, tech stack, compliance, and integration. A $120,000 estimate can quickly escalate to $180,000 once maintenance, security audits, and infrastructure are factored in.

This guide helps you learn essential software development cost estimation methods to avoid budget overruns including, industry pricing benchmarks, and frameworks to predict costs with  great accuracy.

TL;DR

Typical Cost Breakdown by Project Complexity (2026 Estimates)

  • Simple Applications (2-3 months): $40,000–$120,000
    (e.g., internal tools, basic mobile apps, MVPs)
  • Medium Complexity (3-6 months): $120,000–$200,000
    (e.g., e-commerce platforms, CRM systems, booking apps)
  • Enterprise/Complex Solutions (6+ months): $200,000–$500,000+
    (e.g., healthcare systems, AI-driven platforms, large-scale ERPs)

Key Cost Drivers

  • Features & Functionality: More advanced features (real-time data, AI, integrations) increase cost.
  • Platform Choice: Cross-platform apps save 30-40% over separate native apps.
  • Team Composition: Senior developers, especially in specialized fields (AI, blockchain), increase costs.
  • Technology Stack: Modern stacks (React, Python) are faster and cheaper than legacy systems.
  • Compliance & Security: Regulatory requirements (e.g., HIPAA, PCI DSS) add significant costs.
  • Maintenance: Ongoing maintenance can add 15-25% of the initial cost per year.

Regional Cost Variations (Hourly Rates)

  • Asia/Africa: $20–$50/hr
  • Latin America: $30–$60/hr
  • Eastern Europe: $40–$75/hr
  • USA/Western Europe: $120–$200+/hr

Project Lifecycle Cost Distribution

  • Planning/Discovery: 5%–10%
  • Development: 30%–50%
  • Testing/QA: 15%–20%
  • Project Management: 5%–15%
  • Maintenance: 10%–25%

How Much Does Software Development Cost in 2026?

The cost of software development in 2026 varies significantly based on project complexity, platform choice, and feature requirements.

Here’s a breakdown of current market data to help you estimate costs effectively:

How Much Does It Cost To Build a Software on the Basis of Complexity?

Costs vary significantly based on project type. Simple apps are budget-friendly and quick to build, while complex enterprise solutions require more time and a higher budget for specialized features and integrations.

Project Type Cost Range Time Frame Key Features Examples
Simple Applications $40,000–$120,000 2-3 months
  • Basic CRUD operations with standard UI
  • Single platform deployment
  • Limited third-party integrations
Internal tools, simple mobile apps, basic SaaS MVPs
Medium Complexity Projects $120,000–$200,000 3-6 months
  • Custom business logic and workflows
  • Multiple user roles and permissions
  • Real-time data synchronization
  • Payment gateway integration
E-commerce platforms, booking systems, CRM applications
Complex/Enterprise Software $200,000–$500,000+ 6-12+ months
  • Advanced architecture (microservices, distributed systems)
  •  AI/ML capabilities
  • Legacy system integration
  • Regulatory compliance
  • Multi-platform deployment with complex synchronization
Healthcare management systems, financial trading platforms, enterprise resource planning

How Much Does Software Development Cost Industry-Wise?

Each industry has unique requirements that drive the costs of software development. Regulatory compliance, integration with existing systems, and scalability are key factors influencing cost in specific industries like healthcare and finance.

Industry Typical Cost Range Key Cost Drivers
Healthcare $75,000–$250,000 HIPAA compliance, EHR integration, patient data security, FDA regulations
FinTech $90,000–$300,000 PCI DSS compliance, banking API integration, fraud detection, regulatory reporting
Logistics/WMS $50,000–$250,000 Real-time tracking, inventory management, multi-location support, IoT integration
E-commerce $40,000–$150,000 Payment processing, inventory sync, shipping integrations, product catalogs

What Are the Cost Differences between Different Platforms for Software Development?

Different platforms have varying cost structures. Cross-platform development offers substantial savings by reusing code across multiple platforms, while native apps and web applications have specific advantages for performance and functionality.

Platform Type Cost Difference Key Characteristics
Native Mobile Development (Single Platform) Base cost Dedicated to one platform (iOS or Android), specialized development required for each platform.
Native iOS + Android 1.8–2.0× the cost of a single platform Requires separate codebases for each platform and specialized developers for both.
Cross-Platform (Flutter/React Native) 30-40% savings compared to separate native apps 90% code reuse across iOS and Android, reducing development time and costs.
Progressive Web Apps (PWA) 20-30% less than native mobile Offline capabilities, app-like experiences, and simpler deployment than native mobile apps.
Web Applications 15-25% less than mobile apps for equivalent functionality Standardized deployment and testing environments result in lower costs compared to mobile app development.
 The Key Insight: Don’t focus solely on initial development cost. A $100,000 project with poor architecture may incur $40,000 annually in maintenance, while a well-built $150,000 project could cost only $20,000 per year to maintain.

Get a Transparent Estimate for Your Software Project

Don’t let uncertainty derail your project. Contact us today for a detailed, obligation-free estimate that outlines your software development costs with clarity.

What Are the Most Reliable Cost Estimation Techniques in Software Development?

Reliable software cost estimation relies on four proven methodologies, each with specific use cases and accuracy rates. Choosing the right technique can make a significant impact on your project’s success.

software cost estimation techniques

1. Bottom-Up Estimation (High Accuracy)

Considered the most accurate when the project scope is well-defined, this method involves breaking down the project into granular tasks and estimating each component’s cost.

Here’s how you can do that:

  • Break project into individual tasks and subtasks
  • Estimate hours required for each task
  • Sum up estimates for total cost
  • Include buffer time for testing and integration

A Real Example
A custom CRM project:

  • User authentication module: 80 hours
  • Contact management: 120 hours
  • Email integration: 60 hours
  • Reporting dashboard: 100 hours
  • Testing and QA: 80 hours
  • Project management: 60 hours

Total: 500 hours × $150/hour = $75,000

Best for: Medium to large projects with defined requirements, where investor-grade accuracy is needed or fixed-price contracts require minimal variance.

2. Top-Down/Analogous Estimation (Mid-Level Accuracy)

This method leverages historical project data to make quick estimates based on similar past projects.

Here’s how you do that:

  • Identify similar past projects
  • Adjust for differences in scope, complexity, and requirements
  • Apply percentage-based adjustments

For Example: We built a similar inventory management system for $120,000. However, the project in discussion has 30% more features and requires mobile support, so we estimate $156,000.

Best for: Early-stage planning, budget allocation, or when detailed requirements are unavailable.

3. Parametric Estimation (COCOMO II) (Average-Level Accuracy)

Data-driven models like COCOMO II use statistical relationships between project variables and costs to provide a more consistent estimate.

The factors you must consider include:

  • Lines of code or function points
  • Team experience level
  • Development environment maturity
  • Product complexity rating
Best for: Large enterprises with substantial project data or when building business cases requiring defendable methodologies.

4. Three-Point/PERT Estimation (Risk-Aware)

This technique accounts for uncertainty by considering three potential scenarios: optimistic, most likely, and pessimistic.

Here’s the formula that helps calculating:
Expected Cost = (O + 4M + P) ÷ 6
For Example:

  • Optimistic: $80,000
  • Most Likely: $120,000
  • Pessimistic: $180,000

Expected Cost: ($80K + 4×$120K + $180K) ÷ 6 = $126,667

Best for: High-innovation projects, startups exploring new markets, or when risk transparency is crucial.

 How to Choose the Right Method

Project Characteristic Recommended Method
Well-defined scope, need high accuracy Bottom-Up
Early planning, rough budgeting Top-Down
Large organization with data history Parametric
High uncertainty, need risk ranges Three-Point
Critical business decision Combine 2-3 methods

When estimates from different methods vary by more than 25%, it may indicate missing requirements, underestimated technical risks, or scope ambiguity. This discrepancy is an opportunity to uncover further details before committing.

What Key Factors Drive Software Development Cost Estimation?

To keep up with evolving software development trends, understanding the driving factors is essential for accurately estimating costs. Here’s a breakdown of current market data to help you estimate costs effectively:

software development cost drivers

1. Project Complexity & Feature Set

Not all features cost the same, architecture complexity often matters more than feature count.

  • Basic Complexity ($): CRUD operations, simple authentication, basic reporting, template-based UI
  • Medium Complexity ($$): Role-based access, real-time notifications, API integrations, custom business logic
  • High Complexity ($$$): AI/ML algorithms, real-time data sync, blockchain integration, advanced security

2. Development Team Location & Rates

Geographic differences are a major cost factor. Rates vary widely across regions:

Region Hourly Rate Range Quality Level Timezone Overlap (US)
United States $120-$200/hour Excellent Perfect
Western Europe $100-$180/hour Excellent Moderate
Eastern Europe $40-$75/hour Very Good to Excellent Good (4-7 hr overlap)
Latin America $40-$70/hour Good to Very Good Excellent
Asia (India) $20-$50/hour Variable Poor (opposite timezone)
Asia (Philippines) $25-$55/hour Good Moderate
Real Impact: A project in the U.S. could cost around 60% more compared to an Eastern European team, with the potential to save while still maintaining the same level of quality.

 3. UI/UX Design Investment

Design directly influences development complexity and user adoption. Design tiers are:

  • Template-Based Design: $5,000-$15,000
  • Custom Brand Design: $15,000-$30,000
  • Advanced Interactive Design: $30,000-$50,000+

4. Technology Stack Selection

The choice between modern and legacy technologies affects both upfront costs and long-term maintenance:

  • Modern Stack Advantages: Faster development, lower rates, abundant talent (React, Python, PostgreSQL)
  • Legacy Technology Challenges: Higher costs, specialized developers, longer development cycles

5. Platform Strategy Impact

Your platform choice creates multiplier effects on cost:

  • Web Application First: Lower initial investment, broader accessibility, easier maintenance
  • Native Mobile (iOS + Android): Higher cost (1.8-2× single platform), better performance, higher maintenance
  • Cross-Platform (Flutter/React Native): 30-40% savings, 90% code reuse, slightly reduced performance for graphics-heavy apps

6. Compliance & Security Requirements

Compliance adds substantial costs but is essential in regulated industries:

  • HIPAA Compliance (Healthcare): $10,000-$50,000+
  • GDPR Compliance (EU): $8,000-$30,000
  • PCI DSS (Payment Processing): $15,000-$60,000
  • Penetration Testing: $5,000-$20,000 per test

7. Third-Party Integrations & APIs

Integration complexity drives costs:

  • Simple Integrations: $5,000-$10,000 (payment gateways, email services)
  • Complex Integrations: $10,000-$50,000+ (ERP systems, legacy databases)

8. Architecture & Scalability Requirements

Architecture decisions impact both short-term and long-term costs:

  • Monolithic Architecture: Lower initial cost, faster time-to-market, more difficult to scale
  • Microservices Architecture: Higher upfront cost (30-50%), better scalability, ideal for growth

How to Estimate Enterprise Software Costs with Legacy System Integration

Estimating the cost of software development in enterprise environments can be a complex task, especially when legacy system integration is involved. These integrations often add significant costs, typically 30-50%, due to the hidden complexities associated with older systems.

The key cost drivers include:

enterprise software integration cost drivers

Data Migration ($10,000–$40,000+)

Legacy systems often present challenges such as:

  • Inconsistent data formats accumulated over the years
  • Undocumented business rules embedded in legacy code
  • Data quality issues requiring extensive cleanup
  • Multiple systems of record for the same information

The complexity of migration scales with:

  • Data volume: Large data sets (millions of records) require automated processes
  • Number of source systems
  • Data transformation requirements
  • Historical data retention policies

API Development for Legacy Systems ($15,000–$60,000)

Older systems rarely support modern APIs, necessitating custom solutions, which involve:

  • Building custom API layers
  • Handling authentication with outdated security protocols
  • Creating data transformation middleware
  • Implementing rate limiting and error handling mechanisms
  • Reverse-engineering undocumented systems

Integration Middleware Layer ($20,000–$80,000)

Complex enterprise environments require sophisticated middleware to:

  • Orchestrate communication between new and legacy systems
  • Handle transaction management across disparate systems
  • Provide robust monitoring and logging
  • Manage version compatibility across integrated systems
  • Ensure data consistency during communication between systems

Extended Testing Overhead (Add 20-30% to Timeline)

Testing enterprise integrations requires a thorough approach to ensure that all systems function properly:

  • Creating test data that matches production scenarios
  • Conducting integration testing across multiple systems
  • Performance testing under realistic load conditions
  • Regression testing to ensure legacy systems still perform as expected
  • User acceptance testing with business users to verify usability and reliability

Risk Mitigation Strategies

Here’s how you can mitigate the challenges:

Conduct an API Audit First ($5,000–$10,000)

Before diving into the integration process, invest in a technical discovery phase to:

  • Document existing APIs and their protocols
  • Identify key integration points
  • Assess the quality of the data
  • Review any available system documentation

Adopt a Phased Integration Approach

Start with read-only integration to understand the behavior of the legacy system before attempting bidirectional data synchronization. This reduces risk and provides valuable insights before fully committing to the integration.

Hire Dedicated Integration Specialists

Engage developers with experience in enterprise integration patterns and specific legacy technologies. Junior developers may struggle with undocumented systems, leading to extended timelines and additional costs.

Implement Integration Monitoring from Day One

Establish visibility into the health of your integrations early on to prevent minor issues from escalating into major problems. Implement logging, alerting, and real-time dashboards to track integration performance.

By understanding the unique challenges posed by legacy system integration, enterprises can better estimate their software development costs, reduce risks, and ensure smoother project execution.

What Hidden Costs Should You Account For in Software Development?

Beyond developer hours and project management, numerous invisible costs can add up over the software lifecycle. Failing to account for these can lead to budget shortfalls long after launch.

1. Infrastructure Costs ($5,000–$30,000 Annually)

Cloud Hosting

  • Startup: $50–$200/month (low traffic, small database)
  • Growth: $200–$1,000/month (increasing users, data storage)
  • Scale: $1,000–$10,000/month (high availability, multi-region)

2. DevOps & CI/CD Setup ($5,000–$15,000 one-time)

Automated pipelines are essential for rapid iteration and reducing human error.

3. Monitoring & Performance Tools ($100–$500/month)

  • Application performance (e.g., New Relic, Datadog)
  • Error tracking (e.g., Sentry, Rollbar)
  • Uptime and log monitoring

4. Compliance & Legal Costs ($10,000–$100,000+)

Compliance costs vary significantly depending on whether the organization is pursuing formal certification or simply engineering toward alignment. For mid-sized SaaS platforms, compliance preparation and audits can add $30,000 to $120,000+ to overall program costs, depending on scope and audit depth.

  • Software Licenses & Tools: $2,000–$10,000/year (development tools, design software, project management platforms)
  • Legal Document Drafting: Terms of Service ($2,000–$5,000), Privacy Policy ($2,000–$5,000), EULA ($1,500–$4,000)
  • Compliance Audits: HIPAA assessment ($5,000–$20,000), SOC 2 ($20,000–$50,000), PCI DSS ($10,000–$30,000)

5. Quality Assurance Costs (15–25% of Development Budget)

QA is often underestimated. It includes:

  • Manual Testing: Typically 15-20% for thorough coverage
  • Automated Test Infrastructure ($10,000–$30,000): Test framework, automated suites, CI/CD integration
  • Device/Browser Testing: Lab or cloud services ($200–$1,000/month), accessibility tools

6. Ongoing Maintenance & Evolution (15–25% of Initial Cost Per Year)

  • Mandatory Maintenance: Security patches, third-party API updates, OS/platform updates, browser compatibility
  • Performance Optimization ($10,000–$50,000 post-launch): Database query optimization, caching strategies, CDN implementation, code refactoring

How to Reduce Software Development Costs Without Sacrificing Quality

Strategic cost reduction focuses on maximizing value rather than cutting corners. Here are 8 proven ways to save on software development without sacrificing quality:

software development cost reduction strategies

1. Start with an MVP (Save 40-60%)

Launch with only core features to validate assumptions and expand based on real user data.

  • Includes: Essential features, basic UI, minimal infrastructure
  • Delays: Advanced reporting, admin features, optimizations

2. Choose Nearshore Over Local (Save 50-60%)

Outsource to Eastern Europe or Latin America to save on labor costs while benefiting from cultural compatibility and time zone overlap.

3. Use Cross-Platform Frameworks (Save 30-40% on Mobile)

Save by using frameworks like Flutter or React Native for a single codebase across iOS and Android.

  • Native Apps: $160,000
  • Cross-Platform: $100,000
  • Savings: $60,000

4. Invest in Discovery Phase (Avoid $50,000+ in Scope Creep)

Spending $5,000-$15,000 on discovery prevents costly rework by identifying hidden requirements and aligning expectations early.

Kickstart Your Project with a Discovery Phase

Avoid costly scope changes with a detailed discovery phase. Let’s uncover your project’s exact requirements before development begins.

5. Use Phased Delivery (Validate Before Full Build)

Release in stages, validating with users before investing in further development.

  • Phases: $120,000 spread over 7 months with validation at each stage.
  • Benefits: Reduces risk and spreads investment.

6. Right-Size the Team (Don’t Overhire)

Smaller teams (3-5 developers) are more efficient due to lower communication overhead and faster decision-making.

Data: A 3-person team outperforms a 6-person team with mixed experience levels due to fewer communication paths.

7. Leverage Existing Solutions (Build Only What’s Unique)

Use proven libraries and services for non-core functions (e.g., authentication, payment processing).

  • Custom Payment Processing: $40,000–$80,000
  • Using Stripe: $5,000–$10,000
  • Savings: $30,000–$70,000

8. Choose the Right Engagement Model

Select the best model for your needs:

  • Staff Augmentation: For short-term skill gaps
  • Dedicated Team: For long-term projects
  • Fixed Price: For well-defined projects
  • Time & Material: For evolving requirements

How to Calculate ROI for Software Development Projects

Calculating ROI for software development transforms it from a cost into a strategic investment. Here’s how to build an ROI model:

Core ROI Formula

  • ROI = (Net Profit ÷ Total Investment) × 100
  • Net Profit = Gains from Investment – Cost of Investment
  • Total Investment = Development + Infrastructure + Maintenance + Opportunity Costs

Key Metrics beyond Revenue

Time Savings (Labor Cost Reduction)

  • Manual Process: 5 employees, 10 hours/week → $91,000/year
  • Automation: 80% savings → $72,800/year

Error Reduction (Cost Avoidance)

  • Shipping Errors: 200 errors/year → $9,000 cost
  • Software: Reduces errors to 0.4% → $7,200 savings

Revenue Enablement (New Capabilities)

  • New Online Channel: Adds $200,000/year in revenue
  • Customer Acquisition Cost (CAC) Reduction
  • Improved Conversion: Reduces CAC from $100 to $57 → Saves $43,000/year

Complete ROI Calculation Example

  • Total Investment (Year 1): $181,000
  • Annual Benefits: $353,000
  • Year 1 Net Profit: $353,000 – $181,000 = $172,000
  • Year 1 ROI: 95%
  • Payback Period: 6.2 months
  • 3-Year Cumulative ROI: 282%

Custom vs. Off-the-Shelf Software

Off-the-Shelf:

  • Lower initial cost ($5,000-$50,000), but limited customization
  • Best for standard workflows and smaller businesses

Custom Software:

  • Higher upfront cost ($50,000-$300,000+), but offers tailored solutions, competitive advantage, and scalability
  • Best for unique needs and long-term investment

Break-Even Analysis Example

Off-the-Shelf Solution:

  • Implementation: $15,000
  • 5-Year Total: $165,000
  • Requires 15 hours/week of manual work, adding $109,200 in labor costs
  • True Cost: $274,200

Custom Solution:

  • Development: $120,000
  • 5-Year Total: $220,000
  • Provides automation and saves $109,200 in labor costs, making it $54,200 less expensive over five years.

Custom Software vs. Off-the-Shelf Solutions: When Do They Make Financial Sense

Custom Software Off-the-Shelf
Unique workflows or competitive differentiation Standard workflows
Scalability for 100+ users Small user base
Long-term investment (3+ years) Short time horizon
Critical integration and data control Limited resources for maintenance

Calculate Your Project’s ROI Before You Start

Schedule a consultation to explore the potential return on investment for your software project, understand the financial impact before making any commitments.

Your Next Step for Successful Software Development

Accurate cost estimation starts with understanding your project’s unique needs, whether it’s healthcare, fintech, logistics, ecommerce or anything else. Choosing the right methodologies and working with experienced teams ensures predictable, transparent outcomes.

Need help estimating your custom software project? AppVerticals has delivered over 200 successful projects across various industries, providing clear and accurate estimates within 48 hours, no obligation, just transparency.

The gap between a $120,000 estimate and a $180,000 final cost often comes down to asking the right questions upfront. Let’s start with those questions.

Get Your Custom Software Estimate in 48 Hours

Need a reliable estimate for your software development project? AppVerticals delivers accurate, transparent estimates tailored to your needs, within 48 hours.

Webflow vs WordPress (2026): Which CMS Is Better for SEO, Performance & Business Growth?

Your CMS choice, Webflow or WordPress, shapes more than your site’s look; it impacts SEO, growth potential, budgets, workflows, and upkeep. At AppVerticals, we’ve helped dozens of startups, agencies, and enterprises select and build CMS architectures that maximize SEO, performance, and growth.

I have compared both platforms using practical criteria that founders, marketers, and agencies actually care about: setup speed, SEO control, pricing, usability, collaboration, and future trends. No hype. No assumptions. Just clear comparisons so you can choose the right CMS for your business goals.

Webflow vs WordPress: Key Differences at a Glance

Feature Webflow WordPress
Setup & Onboarding Faster visual setup (minutes to hours); all-in-one platform with hosting included Requires hosting, domain configuration, and installation (hours to days)
Design Flexibility Visual-first, pixel-perfect design control; no-code canvas with real CSS/HTML output Theme-dependent or requires custom development; visual builders via plugins (Elementor, Divi)
Learning Curve Steeper initial learning curve; understanding web design concepts needed Easier for beginners; extensive documentation and community tutorials
Customization Limited to Webflow’s framework; custom code possible but constrained Virtually unlimited via 60,000+ plugins and themes; full code access
SEO Capabilities Built-in SEO tools (meta tags, structured data, clean code) Plugin-driven (Yoast, RankMath); granular control but requires configuration
Performance & Speed Managed hosting optimized for speed; average load <2s Depends on hosting, theme, and plugins; can be optimized but requires effort
E-commerce Native e-commerce, max 15,000 SKUs WooCommerce, unlimited SKUs; more payment gateways & extensions

What Sets Webflow & WordPress Apart?

Webflow and WordPress differ mainly in control and structure. Webflow is an all-in-one, managed platform with built-in hosting and minimal maintenance, making it faster and simpler to launch. WordPress is open-source, offering full ownership but requiring separate hosting and ongoing management.

At AppVerticals, we help businesses with CMS development, guiding them to choose and build the right solution for their needs.

Setup & Learning Curve

  • Webflow: Designers and marketers can build visually without extensive coding knowledge. Initial onboarding still requires understanding layout concepts.
  • WordPress: Requires domain setup, hosting configuration, theme selection, and plugin management before publishing.
Summary: Webflow reduces technical setup. WordPress offers more control but requires more configuration.

Design Flexibility & Customization

  • Webflow: Pixel-level design control through a visual editor. Ideal for custom layouts without heavy development.
  • WordPress: Unlimited design potential through custom themes or builders. However, visual builders can introduce performance tradeoffs depending on implementation.
Summary: Designers often prefer Webflow for control without coding. Developers may prefer WordPress for fully custom architectures.

Content Management & Scalability

  • Webflow: Structured CMS collections work well for portfolios, marketing content, and moderate publishing volumes.
  • WordPress: Built for large content libraries, complex taxonomies, and editorial workflows.
Summary: WordPress typically scales better for content-heavy blogs and enterprise publishing.

Whether you’re scaling a content-heavy site or optimizing for marketing agility, our CMS development team at AppVerticals helps businesses implement solutions that perform and scale efficiently

Performance & Core Web Vitals

  • Webflow: Hosting and code output are standardized, reducing performance inconsistencies.
  • WordPress: Performance depends on the hosting provider, theme optimization, caching, and plugin usage.

Practical takeaway

  • Webflow offers predictable performance without extensive optimization.
  • WordPress can achieve strong performance, but requires configuration and monitoring.

SEO Tools & Technical Optimization

Both platforms support strong SEO practices, but the approach differs.

Webflow

  • Built-in meta tag control
  • Custom URL structure
  • XML sitemap generation
  • Clean semantic markup
  • Redirect management

WordPress

  • Extensive SEO plugins
  • Schema customization
  • Advanced content optimization tools
  • Greater flexibility for technical SEO setups
Summary: Webflow provides streamlined SEO basics. WordPress offers deeper customization for advanced SEO strategies.

Security & Maintenance

  • Webflow: Platform handles updates, hosting security, and infrastructure management.
  • WordPress: Requires manual updates, plugin monitoring, and hosting-level security measures.
Implication: WordPress offers flexibility but increases maintenance responsibility.

Collaboration & Agency Workflows

  • Webflow: Built-in design handoff, staging environments, and structured content editing roles.
  • WordPress: Workflow depends on installed plugins and editorial configuration.
Agencies often choose Webflow for faster launch cycles, while WordPress suits long-term content production teams.

What Is the Market Comparison & Adoption of CMS in 2026?

In 2026, WordPress continues to dominate in terms of global website share, CMS adoption, and enterprise usage, powering millions of sites with a mature developer ecosystem.

Webflow, while smaller, is rapidly growing with 23% CAGR, a strong presence among design-focused brands, and impressive e-commerce growth. Both platforms serve distinct needs. WordPress excels in content-heavy and complex deployments, while Webflow offers speed, visual control, and streamlined management.

Metric WordPress Webflow
Global Website Share 43.5% of all websites 0.8% (rapidly growing)
CMS Market Share 61.7% of known CMS websites N/A
Total Sites 861 million 524,000+
Paying Customers N/A (open-source model) 100,000+
E-commerce Presence 17% powered by WooCommerce 647% e-commerce growth (2020–2023)
Developer Growth Mature global ecosystem 23% CAGR
Enterprise / Major Users The Wall Street Journal, The New York Times, CNN, Microsoft News, Coca-Cola, The Walt Disney Company, Meta Discord, Slack (Brand Center), Dropbox (Dropbox Sign), Dell Technologies, Jasper

Key Insight:

  • Webflow offers predictable monthly costs and low maintenance.
  • WordPress provides extensive flexibility, but total costs vary significantly based on hosting, plugins, and development needs.

SEO, Performance & Technical Comparison

  • Page Speed: Webflow <2s, WordPress 3–7s (depends on hosting/plugins)
  • Clean Code: Webflow semantic and minimal; WordPress can be bloated with plugins
  • SEO Tools: Webflow built-in; WordPress plugins (Yoast, RankMath) allow advanced configurations
  • Content Depth: WordPress is better for blogs & content hubs; Webflow is ideal for marketing-focused sites

Which CMS Is Best for Startups, Agencies & Marketing Teams?

Choosing the right CMS depends on your goals and resources. Startups and SaaS companies benefit from Webflow’s fast launch and low maintenance, while product-driven businesses may prefer WordPress for advanced features. Design-focused agencies often favor Webflow for pixel-perfect control, whereas development agencies and content-heavy, SEO-driven sites thrive on WordPress’s flexibility and scalability.

Best Choice for Startups & SaaS

  • Rapid launch timelines favor Webflow.
  • Product-driven companies needing complex functionality may choose WordPress for extensibility.

Best Choice for Agencies & Designers

  • Agencies focused on design-first projects often prefer Webflow.
  • Development agencies building custom functionality frequently use WordPress.

Best Choice for Content-Heavy SEO Sites

  • WordPress remains a strong choice for large blogs, publishing platforms, and multi-author sites due to its advanced content management capabilities.

CMS that aligns with your business needs

CMS Decision Guide (2026)

If You Are… You Should Choose Why You Should Choose It
Startup / Early-Stage SaaS Webflow Faster time-to-market, built-in hosting, predictable pricing, minimal maintenance burden. Ideal for marketing-led growth.
Product-Driven SaaS with Complex Features WordPress Greater extensibility, 60,000+ plugin ecosystem, and easier integration with memberships, portals, or custom functionality.
Design-Focused Agency Webflow Pixel-level visual control, faster client launches, and built-in collaboration and staging tools.
Development Agency WordPress Full code access, unlimited customization, scalable architecture for complex builds.
Content-Heavy Blog / Publisher WordPress Unlimited posts, advanced taxonomies, stronger editorial workflows, proven at enterprise publishing scale.
Marketing Team with Limited Technical Resources Webflow Managed infrastructure, security handled by the platform, no plugin maintenance.
Enterprise with Large-Scale Content & Integrations WordPress Low vendor lock-in, deep integration flexibility, proven scalability across high-traffic environments.

What Is the Pricing & Total Cost of Ownership of CMS Platforms in 2026?

Pricing differences are less about subscription fees and more about long-term maintenance.

Cost Factor Webflow WordPress
Hosting Included Separate
Maintenance Platform-managed Ongoing updates required
Plugins Limited external tools Many paid plugins are possible
Development Lower initial design cost Variable depending on build
Scaling Predictable subscription Hosting + dev cost increases

Estimated Annual Cost by Business Stage (2026)

Business Stage Webflow – Estimated Annual Cost WordPress – Estimated Annual Cost
Small Business $444–$624 / year $500–$2,000 / year
Growing Business $900–$1,800 / year $2,000–$10,000 / year
Enterprise $12,000–$60,000+ / year $10,000–$100,000+ / year
Cost Insight Often 4–5× cheaper than hiring a custom developer for comparable builds “Free” core software, but higher hidden costs in hosting, premium plugins, security, and ongoing development

Key insight: Webflow often offers predictable pricing. WordPress can be cheaper initially, but it may require higher maintenance and development costs over time.

Can Non-Developers Build Better Websites on Webflow or WordPress?

  • Webflow: Non-developers with design understanding can build structured, professional websites directly in the editor.
  • WordPress: Non-technical users rely heavily on themes and plugins; customization often requires developer support.

Reality check: Neither platform is completely “no-skill.” Content creators still need basic UX and structure knowledge.

Webflow or WordPress

Future of CMS Platforms: Is Webflow Replacing WordPress? (2026–2030 Trends)

There is no evidence that one platform is replacing the other. Instead, both are evolving toward different roles.

Observed trends

  • Visual design tools continue to grow in marketing teams
  • Open-source ecosystems remain dominant for large-scale content projects
  • AI-assisted content workflows are influencing both platforms
  • Businesses increasingly choose CMS tools based on team structure rather than trends

Expected direction

  • Webflow likely remains strong for design-led and marketing-focused builds
  • WordPress remains relevant for large publishing ecosystems and complex functionality

Need a Custom CMS That Grows With Your Business? Let AppVerticals Build It. 

From WordPress to Webflow, our experts handle everything from design to deployment.

Final Verdict: Which Platform Should You Choose?

After building CMS architectures for startups, agencies, and enterprise teams, our perspective is clear: the right choice depends on how your business grows. If your website is a marketing engine that needs speed, design precision, and minimal maintenance, Webflow is the smarter move.

If your roadmap includes complex functionality, deep integrations, or large-scale content operations, WordPress offers the flexibility and long-term control you’ll need. The best CMS isn’t the most popular one; it’s the one aligned with your team structure, technical capacity, and growth strategy.

Best WMS Software for 2026: Top Picks & When to Choose Custom Solutions

If you’re a founder, operator, or investor evaluating WMS software, avoid the common mistake of treating it as a basic inventory tool.

The warehouse management system market is projected to grow from $2.7B (2021) to $12.3B (2031) at a 16.3% CAGR, which is why WMS decisions are getting more strategic (and harder to reverse).

Having worked on both successful and challenging WMS projects, I’ve learned that the solution often lies in redesigning workflows, strengthening integrations, and focusing on data quality, rather than just training the team.

This guide will help you discover the best WMS solution that suits your specific use case or business needs, while also highlighting when a custom WMS might be the ideal choice.

Key Takeaways:

  • WMS Market Growth: The warehouse management system market is expected to grow from $2.7B in 2021 to $12.3B in 2031, with a 16.3% CAGR, making strategic WMS decisions more crucial than ever.

  • Choosing the Right WMS: The best WMS for your business aligns with your specific fulfillment model, integrates seamlessly with existing systems, and scales as you grow. It should also handle exceptions effectively.

  • Cloud vs. On-Prem vs. ERP-Embedded: Cloud-based WMS reduces infrastructure burden, on-prem solutions are ideal for strict connectivity needs, and ERP-embedded systems offer convenience but need validation for warehouse workflows.

  • Top WMS Vendors: Leading solutions like Blue Yonder, SAP EWM, Oracle, and Infor offer advanced features like AI, real-time visibility, and strong integrations. Each is tailored to different operational needs, from ecommerce to large enterprises.

  • Custom WMS Considerations: A custom WMS may be the ideal choice if your business requires unique workflows, complex integrations, or specialized billing logic, particularly in 3PLs or for competitive advantages.

  • Custom WMS Solutions: AppVerticals offers custom logistics software development to create tailored WMS solutions, optimizing workflows, integrations, and scalability to match your operational needs.

Which WMS Software Is Best (and best for what type of warehouse)?

The best WMS is the one that aligns with your warehouse’s complexity and integration needs. While this may seem obvious, it’s often where most selection processes lose focus. In practice, the best WMS typically meets these criteria:

which wms software is best for my warehouse

  • It supports your fulfillment model (ecommerce, retail, manufacturing, 3PL).
  • It handles exceptions (damaged inventory, short picks, substitutions) without relying on spreadsheets.
  • It integrates seamlessly with your existing systems (ERP, TMS, ecommerce), with clear failure modes and monitoring.
  • It scales with your growth, handling more SKUs, orders, locations, and automation.

However, if the available WMS options don’t align with your unique requirements, whether due to complexity, integration limitations, or specific business processes, you may need to consider custom WMS software development.

AppVerticals offers logistics software development services that can help build a custom solution tailored to your precise operational needs, ensuring flexibility and scalability as your business evolves.

Need a Custom WMS? We Can Help.

If off-the-shelf solutions aren’t cutting it, AppVerticals can design a WMS tailored to your unique workflows and integration

Cloud vs On‑prem vs ERP-embedded WMS

As WMS vendors’ feature lists converge, buyers are focusing on architecture and integration as key differentiators in 2026. Operators now prioritize factors like technical architecture, integration capabilities, analytics/AI, user experience, and product support, rather than just core functionalities.

A few practical insights include:

WMS Type Key Benefits Considerations
Cloud/SaaS WMS Reduces infrastructure burden and streamlines upgrades (assuming backward compatibility) Ideal for businesses looking to reduce hardware reliance and simplify maintenance.
On-prem WMS Relevant for strict connectivity requirements, legacy automation systems, or regulatory constraints May require higher initial investment for hardware and maintenance.
ERP-embedded WMS Offers convenience with integration to ERP systems Requires validation of execution features and RF workflows for optimal warehouse performance.

 Best-by-Scenario Snapshot

  • Ecommerce/DTC Fulfillment: Prioritize pick/pack speed, barcode flows, multi-warehouse capabilities, and smooth integrations.
  • Retailers: Focus on omnichannel fulfillment, store-based fulfillment logic, and inventory accuracy.
  • 3PLs: Emphasize multi-client support, activity-based billing, SLAs, and reporting segmentation.
  • Enterprises: Focus on ERP integration, labor management, automation orchestration, and governance for multi-site rollouts.

Most Popular WMS Software Options to Shortlist in 2026

While popularity can help build an initial shortlist, it shouldn’t be your only deciding factor. Still, it’s useful for investor decks and early-stage evaluations. Below are some of the most frequently mentioned WMS vendors from leading industry sources:

best wms software options

1. Blue Yonder Warehouse Management

A comprehensive enterprise-scale WMS designed for complex supply chains and high-volume operations.

  • Features: Advanced AI-driven analytics, automation, and end-to-end supply chain optimization.
  • Key Offerings: Predictive insights, real-time visibility, scalability, and demand forecasting.

2. SAP EWM (Extended Warehouse Management)

A robust WMS that seamlessly integrates with SAP ERP systems, catering to large enterprises with complex needs.

  • Features: Real-time warehouse monitoring, automation, and efficient resource management.
  • Key Offerings: Advanced automation, global scalability, in-depth analytics, and deep SAP integration.

3. Oracle Warehouse Management Cloud

A cloud-native WMS offering full integration within the Oracle ecosystem, designed for enterprises looking for flexibility and scalability.

  • Features: Real-time monitoring, mobile access, and powerful analytics powered by Oracle Cloud.
  • Key Offerings: Seamless ERP integration, scalability for global operations, real-time visibility, and continuous updates.

4. Infor WMS

A powerful WMS solution designed for large and mid-market businesses, with strong AI/analytics positioning.

  • Features: Advanced AI, predictive analytics, and inventory optimization.
  • Key Offerings: Real-time inventory visibility, workflow automation, and seamless integration with enterprise systems.

5. Manhattan Active Warehouse Management

A flexible, enterprise-level WMS offering deep labor management integration and high scalability.

  • Features: Real-time tracking, labor management, and complex supply chain support.
  • Key Offerings: Strong market presence, mobile-enabled, robust analytics, and adaptable to a variety of industries.

6. Körber Supply Chain Software WMS

A highly configurable WMS designed for complex warehouses that require tailored workflows and system integrations.

  • Features: Flexible configurations and deep integration into broader enterprise systems.
  • Key Offerings: Custom workflows, end-to-end visibility, scalability, and seamless integration with third-party systems.

7. Softeon WMS

A flexible WMS focused on providing tailored solutions for various industries with complex operational needs.

  • Features: Customizable features and modular architecture.
  • Key Offerings: High adaptability, configurable workflows, and support for a variety of industries and business sizes.

8. Fishbowl WMS

A cost-effective WMS solution targeting small to mid-market businesses, often used alongside QuickBooks for streamlined inventory management.

  • Features: Simple inventory management, barcode scanning, and real-time stock tracking.
  • Key Offerings: Affordable pricing, seamless QuickBooks integration, inventory control, and order fulfillment capabilities.

9. Zoho Inventory

An entry-level WMS for SMBs, offering easy integration with Zoho’s suite of applications and a user-friendly interface.

  • Features: Basic inventory management, mobile app support, and order tracking.
  • Key Offerings: Cost-effective inventory management, integration with Zoho apps, and scalability for growing businesses.

Best WMS Software Vendors for Specific Use Cases

Unlike the generic top 10 warehouse management systems, selecting the best WMS requires mapping your use case to the must-have capabilities.

For teams evaluating best WMS software this year, AI is showing up less as a gimmick and more as a workflow accelerator (triage, diagnostics, scenario planning). AI agents are quickly becoming the newest available AI feature across WMS, helping teams manipulate data, map scenarios, and diagnose issues faster, highlights Gaven Simon, ARC Advisory Group analyst.

Below are the ideal WMS solutions tailored for key industries and operational needs:

WMS software selection guide

Best WMS for Ecommerce Integrations (Shopify/Marketplaces)

Ecommerce growth requires a WMS that functions as a real-time execution layer, seamlessly syncing with your storefront and shipping stack.

Prioritize in demos:

  • Barcode-first pick/pack flows
  • Fast receiving and directed putaway
  • Multi-warehouse inventory visibility
  • Returns workflows (RMA-like logic, dispositioning)
  • Carrier and rate shopping integration
  • Clear failure handling for integration lags (order duplication, backorders)

Top Choice: ShipHero Integrates ecommerce platforms for real-time updates, barcode scanning, analytics, and faster workflows.

Best WMS for Retailers (Omnichannel + Stores-as-Fulfillment)

Retailers need a WMS that ensures inventory accuracy across all nodes (warehouse, store, 3PL, or drop-ship) and enables seamless fulfillment from the best location.

Look for:

  • Store replenishment workflows and allocations
  • Cycle counting discipline and variance handling
  • Lot/serial tracking for regulated or high-value items
  • Exception handling (substitutions, partial shipments)

Top Choice: SAP EWM is the best option for omnichannel operations, offering real-time visibility and inventory accuracy across stores and warehouses.

Best WMS for 3PL (Multi-client, Billing, SLAs)

For 3PLs, a WMS needs to handle multi-client inventory, workflows, SLAs, and billing. Client segmentation and billing rules often make this more complex than a standard WMS.

Prioritize:

  • Client-level inventory ownership and specific workflows
  • Client-specific SLAs and reporting
  • Activity-based billing and value-added services

Top Choice: Manhattan Active WMS offers a multi-client support, activity-based billing, and flexible SLAs to meet 3PL demands.

Best WMS for Large Enterprises (ERP Integration + Controls)

For enterprises, the WMS decision revolves around integration with ERP systems, labor management, automation orchestration, and governance for multi-site rollouts.

Focus on:

  • ERP integration stability (master data, inventory valuation)
  • Labor management and engineered standards
  • Automation orchestration (AMRs, conveyors, sortation)
  • Multi-site rollout governance and change control

Top Choice: Oracle Warehouse Management Cloud offers strong ERP integration, automation orchestration, and enterprise-scale capabilities.

What Features to Prioritize When Evaluating WMS Software for Scalability and ERP Integration

When evaluating WMS software for scalability and ERP integration, I recommend using a two-layer approach: execution features and system qualities.  The core WMS functions include inventory management, order management, receiving/putaway, picking/packing strategies, shipping, and barcoding/RFID integration.

Here’s the demo checklist I’d use to evaluate vendors:

Receiving, Putaway, and Slotting (Accuracy is Key)

Ask vendors to demonstrate:

  • ASN receiving (if applicable)
  • Handling units (pallet/case/each)
  • Directed putaway rules (weight, velocity, temperature zones, etc.)
  • Dynamic slotting or at least a slotting-friendly data model

Picking Strategies for Your Order Profile

Since picking impacts labor costs, validate:

  • Wave/batch/zone picking options
  • Cart-based picking (especially for ecommerce)
  • Pick path optimization logic
  • Exception handling for short picks, damaged items, substitutions, and “can’t find” workflows

Packing, Shipping, and Labels (Ensure the Last 20 Feet Work)

For real-world efficiency:

  • Speed and reliability of packing stations
  • Accurate label printing
  • Smooth carrier manifests and tracking reconciliation

Barcoding/RF Scanning (Optional: RFID)

RF scanning is essential in any serious WMS:

  • Ensure strong barcoding/scanning integration and consider RFID for higher operational efficiency

Integration: ERP/TMS/Ecommerce/EDI + Monitoring

Integration failures often go unnoticed. Ask:

  • What’s available out-of-the-box vs. custom integrations?
  • Do you support APIs and event-based patterns (e.g., webhooks, queues) or only scheduled polling?
  • How do you monitor failed transactions?
  • Can warehouse ops view integration errors without needing to open a support ticket

How Do Pricing Models Compare Across Top WMS Software?

To effectively budget and forecast ROI, break down these components:

  • License Model
  • Implementation Costs
  • Ongoing Operational Costs
  • Hidden Costs

Pricing Models

  • Subscription: Often per user, per warehouse, tiered, or pay-as-you-go
  • Perpetual License: One-time fee, more common in on-prem solutions
  • Free/Open-Source: Software is free, but there are implementation and maintenance costs

Common Hidden Costs

  • Data migration
  • Training
  • Maintenance and upgrades
  • Hardware/IT (scanners, mobile devices, servers, networking)
Key Tip for Founders/Investors: When reviewing a budget proposal, quickly check for integration and data-cleaning line items. If they’re missing, the budget is likely unrealistic.

How Do I Determine ROI for Implementing WMS Software in a Growing Logistics Business?

For leadership teams, measuring ROI becomes easier when tied to specific, quantifiable outcomes. According to ShipHero, WMS adoption in ecommerce improves critical operational metrics.

Here is the list of some real and measurable ROI Levers:

  • Pick Accuracy: Fewer reships and credits due to improved picking precision.
  • Labor Efficiency: More lines picked per hour and reduced travel time within the warehouse.
  • Cycle Count Efficiency: Lower discrepancies between physical inventory and system records.
  • Faster Receiving and Putaway: Reduced congestion and faster stock availability.
  • Better Order Cutoffs: Fewer late shipments and missed deadlines.

Simple ROI Worksheet (Track Baseline vs. Post-Go-Live)

  • Orders per day
  • Lines per order
  • Pick accuracy percentage
  • Labor hours per shift
  • Overtime hours
  • Returns due to incorrect items
  • Inventory variance (count-to-system delta)

Payback expectation: Many teams target a 1–3 year payback window, depending on complexity and how quickly workflows and integrations stabilize.

What Are the Risks and Technical Challenges When Migrating from a Legacy WMS?

Migration isn’t simply about moving data, it’s about rebuilding operational truth. Below are the common failure modes I watch for during the migration of either a warehouse management system or a warehouse management application.

Failure Modes to Watch For

  • Location Hierarchy Mismatches: Legacy systems often had implicit rules, while modern WMS require explicit structures.
  • Unit-of-Measure Confusion: Misunderstandings between cases, eaches, and pallets.
  • Lot/Serial History Not Migrated Properly: Incomplete migration of historical data.
  • Integration Cutover Issues: Risks like double-shipping or orphan orders during system switchover.
  • Overconfidence in Parallel Runs: Running both systems in parallel without proper reconciliation often leads to errors.

Practical Mitigations

  • Freeze windows for master data changes.
  • Conduct a full dress rehearsal, including scanners and printers, to ensure smooth cutover.
  • Build reconciliation reports early for orders, inventory, and shipment confirmations.
  • Define rollback decision points in advance to ensure a clear path in case of failure.
‘Security has also moved from ‘IT checkbox’ to ‘customer requirement’. Everybody wants that level of security, you want to make sure the system is secure and not susceptible to ransomware.’, says Sean Moore, CIO CJ Logistics.

When Should You Build a Custom WMS Solution Instead of Buying Software?

Not all business situations can be dealt with an existing WMS software, but it’s where strategic decisions are made. You might consider a custom WMS if:

Your Workflows Are a Competitive Differentiator

If your warehouse processes give you a competitive edge, such as same-day delivery, unique kitting, or specialized compliance flows, off-the-shelf solutions might be too restrictive.

Your Integrations Are Too Specific

If you have a complex tech stack (ERP, multiple storefronts, TMS, EDI), a custom WMS layer can reduce system fragility.

You’re a 3PL with Non-Negotiable Billing and SLAs

For 3PLs, the need for customized billing logic and specific SLAs often makes off-the-shelf solutions require extensive customization anyway, making a custom build a more viable long-term solution.

What to Customize vs. Standardize:

  • Standardize: Basic functions like barcode flows, inventory models, and core pick/pack patterns.
  • Customize: Unique needs like billing logic, client segmentation, exception policies, and system orchestration.
Key Insight: Custom WMS doesn’t always mean building from scratch. The best solution often involves building custom modules around a commercial WMS, focusing on integrations, billing, exception handling, and automation, while leaving basic functionality intact.’, says Sean Moore, CIO CJ Logistics.

How Can AppVerticals Help Design and Build a Custom WMS That Fits Your Operation?

When selecting a build partner, look for one that demands clarity on processes, exceptions, and integrations before coding. AppVerticals can be the ideal partner if you’re not replacing your WMS but need to create custom components that enhance your system, whether its integrations, rule engines, billing logic, or dashboards, without an endless rebuild cycle.

Build the Perfect WMS Tailored to Your Needs

Don’t settle for a one-size-fits-all solution. Let AppVerticals design a custom WMS that adapts to your unique business requirements and growth.

Mobile App Monetization Statistics in 2026: Revenue Benchmarks, Models & Trends

Mobile app monetization is no longer experimental; it’s a $1.2 trillion global economy projected for 2026, with consumer spending on apps hitting ~$155.8 billion in 2025 and in‑app advertising generating ~$390 billion.

Developers and founders who treat monetization as product strategy from day one capture far more value than those who consider it an afterthought. This post distills the most important statistics every app maker must know in 2026, including revenue benchmarks, platform performance, and category-specific trends.

At AppVerticals, we work closely with founders and product teams to design monetization architectures that scale with user growth. The data in this report reflects both current industry benchmarks and patterns we consistently see across apps moving from launch to revenue optimization.

Key Takeaways | App Monetization Statistics in 2026

  • Monetization is product architecture: At AppVerticals, we see revenue decisions shaping onboarding, UX, and retention from day one. Apps that optimize onboarding see up to 40 % higher 30-day retention.
  • Hybrid monetization wins: Combining ads, subscriptions, and IAPs improves lifetime value by ~30 % over single-stream models.
  • Scale ≠ revenue: Strong retention, engagement depth, and monetization timing drive revenue more than download volume. Apps with 100,000 MAU can generate $5K–$100K/month, depending on monetization.
  • iOS drives premium revenue; Android drives reach: iOS users spend ~$12.77/app on average vs. ~$6.19 on Android. Android dominates installs (~60–70 % globally).
  • Retention is the real monetization engine: Average 30-day retention across apps is ~27 %, reinforcing that early engagement determines a monetizable user pool.
  • Category-specific monetization: Gaming leads in IAP (~$81.8 billion revenue in 2025), productivity dominates subscriptions (~30 % of users subscribe monthly), and social apps scale via hybrid models.
  • AI personalization is a revenue multiplier: Dynamic paywalls and predictive churn modeling can improve conversion by 15–25 %.
  • First-party data is the new advertising advantage: Apps with strong behavioral data generate up to 2× higher ad revenue than those relying on third-party targeting.
  • Web-to-app monetization is rising: Subscription-first products increasingly capture revenue outside app stores, improving flexibility and ARPU.
  • Core insight: Successful apps treat monetization as a built-in growth system, not a post-launch feature, aligning product design with measurable outcomes.

Global App Revenue Forecast: How Big Is the Mobile Monetization Market in 2026?

The mobile app market continues to scale rapidly, with both user spending and advertising dollars surging:

  • In‑app advertising was the largest revenue stream worldwide in 2025, with spending around $390 billion, accounting for roughly two‑thirds of total mobile app revenue that year.
  • Global consumer spending on all mobile apps reached ~$155.8 billion in 2025, driven mainly by in‑app purchases and subscriptions.
  • In‑app purchase (IAP) revenue hit $167 billion in 2025, growing ~10 % year‑over‑year.
  • Subscription revenue remains a fast‑growing segment, with paid subscriptions generating $120 billion in 2025, and average monthly subscription fees rising to around $10.20.
  • A broader forecast suggests the global mobile app monetization market could reach $1.2 trillion by 2026, underscoring the scale of opportunity.
Takeaway: Ads remain dominant, but user spend via in‑app purchases and subscriptions is robust and growing. From our work with early-stage and scaling apps at AppVerticals, founders often underestimate how quickly monetization decisions influence product design. Revenue architecture isn’t just financial; it shapes onboarding, engagement loops, and long-term retention mechanics.

AppVerticals experts see in‑app purchase and subscription revenue extending its growth trajectory in 2026, following $167 billion in global IAP revenue in 2025 and rising overall app consumer spend of $155.8 billion.

How Do iOS and Android Compare for App Revenue in 2026?

iOS dominates revenue and ARPU, while Android dominates installs and ad-driven scale, making iOS ideal for premium monetization and Android essential for massive reach. Platform choice matters for revenue strategy:

Metric iOS Android
Revenue share (global) ~60–65% of total app revenue ~35–40% of total app revenue
Install share (global) ~30–40% of total installs ~60–70% of total installs
User spend per user (general insight) Higher spend per user (developers report iOS users outspend Android users) Lower spend per user

Insight: Prioritize iOS if subscription and high ARPU are critical early in your monetization journey; use Android for reach and ad-driven scale. At AppVerticals, platform sequencing is a major revenue lever. Many subscription-first apps launch on iOS to validate monetization, then expand to Android for broader acquisition and ad-driven scale.

How Does User Retention Impact App Monetization

Monetization only works if users stay engaged:

  • Average 30‑day retention across apps is still relatively low, about 27 % in 2025, reinforcing that early churn is the monetization bottleneck.
  • Push notifications and personalized onboarding can improve early retention metrics.

Locking in engagement early dramatically increases the pool of users who can be monetized, whether through ads, IAPs, or subscriptions.

Turn App Monetization Data Into Real Revenue

Monetization isn’t a feature. It’s architecture. We design apps built for retention, scale, and predictable revenue from day one.

Which Mobile App Categories Drive the Most Monetization?

Gaming, business/productivity, and social/streaming apps drive the most monetization in 2026, gaming leads in in-app purchases, productivity dominates subscriptions, and social/entertainment scales revenue through hybrid ad-plus-premium models.
Which Mobile App Categories Drive the Most Monetization

Gaming Apps

Gaming remains one of the most lucrative categories: in 2025, mobile games generated approximately $81.8 billion in IAP revenue, according to Sensor Tower’s State of Mobile 2026 report.

Industry forecasts suggest that the broader mobile gaming market, including advertising, IAP, subscriptions, and other revenue streams, is expected to grow significantly in the coming years, potentially reaching over $230 billion by 2030 as smartphone penetration, live‑ops engagement, and hybrid monetization strategies expand globally.

Games with diverse monetization features (rewarded ads, battle passes, skins) see the highest spending activity.

Subscription‑Heavy Categories

Business and productivity apps generally drive stronger conversions from free to paid models, thanks to clear ongoing value and premium features. According to ZipDo, in 2023, subscription-based apps generated $212 billion globally, with productivity apps among the top contributors.

Social & Streaming Apps

Social and entertainment apps often combine ad‑driven revenue with optional premium tiers, striking a balance between massive free reach and subscription monetization (market trend: hybrid outcomes).

Monetization Insights: While these patterns are common in social apps, our mobile app development experience at AppVerticals shows that revenue success depends less on app category and more on how clearly value is communicated from the first user interaction.

When a monetization strategy is built directly into the product architecture and aligned with core user motivation, even non-traditional apps can outperform industry benchmarks. This makes early development decisions critical for long-term revenue performance.

How Much Do Mobile Apps Actually Earn in 2026 (By MAU & Downloads)?

Mobile app revenue in 2026 ranges from $10 per month for small apps to $10M+ per month for apps with 1M+ MAU, depending on monetization architecture, retention, engagement depth, and ARPU.

Revenue does not scale linearly with downloads; it scales with monetization design.

Revenue by App Scale (Industry Benchmarks)

App Scale Typical Monthly Revenue Range
1,000 downloads ~$10 – $100+ (ad-heavy or low ARPU)
10,000 downloads ~$300 – $2,000 (freemium + ads)
100,000 MAU ~$5,000 – $100,000+ (hybrid monetization)
1M+ MAU ~$500,000 – $10M+ (optimized monetization)

These ranges show one clear pattern: monetization architecture matters more than raw downloads.

At AppVerticals, we consistently help founders shift focus from “how many installs?” to:

  • Retention quality
  • Engagement depth
  • Monetization timing
  • Revenue per active user

Those are the real drivers behind these benchmarks.

Revenue by Monetization Model (2026 Data)

Different monetization models produce vastly different revenue outcomes depending on category, engagement depth, and user intent.

How Much Do Mobile Apps Actually Earn

Advertising

In-App Purchases (IAPs)

  • IAPs remain dominant in gaming, contributing ~60% of total IAP revenue globally.
  • Average IAP per paying gamer: ~$16.87 (early 2026)
  • Only ~4.2% of gamers convert — proving monetization depends on optimizing high-intent users.

Subscriptions

  • Subscription revenue continues to grow strongly across productivity, streaming, and AI apps.
  • ~30% of mobile users subscribe to at least one app monthly.
  • Subscription apps typically show stronger retention than ad-only models.

Hybrid Models Win

Hybrid monetization (ads + IAPs + subscriptions) improves lifetime value by ~30% compared to single-stream models.

At AppVerticals, we rarely recommend single-stream monetization unless the product is highly niche. Hybrid systems allow apps to monetize:

  • Casual users (ads)
  • Power users (IAPs)
  • High-intent segments (subscriptions)

Without compromising user experience.

Expert Opinion

App monetization is moving away from static paywalls and flat subscriptions toward intelligent, outcome-aligned value exchange. Today, successful apps tie revenue directly to measurable results by charging per usage, per outcome, or per performance metric rather than for vague access.

For example, Duolingo blends freemium access with Super subscriptions and microtransactions like streak freezes, monetizing engagement rather than forcing upfront payment. OpenAI prices API access based on usage, directly aligning revenue with compute consumption. Canva layers free access with Pro subscriptions and paid asset libraries, creating a hybrid monetization stack instead of a single paywall.

We’re also seeing marketplace-driven models like Shopify, which combines subscription tiers with revenue share and embedded payments. Monetization is no longer a pricing-page decision; it’s a product design decision embedded into discovery, experimentation, and behavioral strategy.

– Olena Lazareva, Product Manager | Growth & Monetization

Core Takeaway: In 2026, successful apps don’t ask “How do we charge?” They ask, “Where does value naturally occur in the user journey?” Revenue follows architecture, not installs.

2026 App Monetization Trends Every Founder Should Know

Top app monetization trends in 2026 include hybrid revenue models, AI-driven personalization, rewarded ads, subscription growth, and premium AI features, all focused on maximizing retention, conversions, and lifetime value.

  • AI‑Driven Personalization: Apps leveraging AI for personalization, including paywall timing, dynamic pricing, and churn prediction, are seeing marked improvements in conversion and retention metrics. For example, apps using AI‑powered personalization report up to ~62 % higher engagement and ~80 % higher conversions compared with non‑AI apps.

In enterprise contexts, AI personalization can boost conversion by ~18 % and cut churn by up to ~15 %. Personalized pricing and offer recommendations further drive 10–30 % higher ARPU by matching offers to user behavior at the right moment. These outcomes confirm that AI not only increases engagement:*

  • Precision Advertising: Privacy changes have reshaped ad targeting, but apps with strong first‑party data continue commanding premium ad yields.
  • Web‑to‑App Monetization: External payment flows and web funnels are growing, enabling revenue capture outside traditional app store restrictions, particularly for subscription products.

Expert Opinion

AI-generated code does not emerge from creativity. It emerges from patterns. When insecure patterns appear in training data, they are not copied once. They are reproduced thousands of times across unrelated applications. What used to be isolated developer mistakes can become systemic weaknesses. This does not mean AI should be avoided. Used correctly, AI is an extraordinary tool. But security cannot be automated by generation alone. Growth is inevitable. Resilience is a choice

Leonid Posadskov, Security Expert

Real‑World Monetization Case Studies (2026 Trends)

Several leading apps illustrate how these trends perform in practice:

  • Duolingo blends freemium, ads, subscriptions, and AI personalization. Duolingo generated ~$748M in 2024 revenue, with paid subscribers surpassing 10.9M, pushing it toward a ~$1B annual run rate.
  • Spotify’s ads + premium model delivered ~€4.5B (~$4.9B) in Q4 2025 revenue alone, supported by 290M premium subscribers and 751M MAU.
  • Candy Crush Saga combined IAPs and rewarded ads. It generated ~$1.09B in 2024, with $20B+ lifetime revenue, proving hybrid gaming models scale massively.
  • Subway Surfers
    With 4B+ downloads, Subway Surfers has generated $155M+ lifetime revenue through IAPs and ads — showcasing long-term hybrid sustainability.
  • Integrated rewarded ads have delivered 107%+ ROAS, directly boosting purchase-driven monetization.

monetization case studies

Final Takeaways for Founders & Teams

App monetization in 2026 is no longer a post-launch decision; it’s a product architecture discipline that directly drives revenue and long-term growth. Key metrics we see at AppVerticals:

Metric Category 2026 Benchmark / Data Point
Hybrid Monetization LTV Impact ~30% higher LTV vs single-revenue models
iOS Share of Global App Revenue 60–65%
Android Share of Global Installs 60–70%
Average Spend per App (iOS) ~$12.77
Average Spend per App (Android) ~$6.19
Average 30-Day Retention (All Apps) ~27%
Retention-Optimized Growth Impact 2–3× increase in monetizable users
Gaming IAP Revenue (2025) ~$81.8B
Gaming Revenue Projection (2030) $230B+
Productivity App Subscription Adoption ~30% monthly subscriber base
Global Subscription App Revenue (2023 baseline) $212B
Hybrid Monetization ARPU Lift (Social/Streaming) +10–25%
AI-Powered Conversion Lift +15–25%
AI-Powered Engagement Lift ~62%
AI-Powered ARPU Increase +10–30%
First-Party Data Ad Revenue Impact Up to 2× higher ad revenue
Web-to-App Monetization ARPU Increase ~15%


Core insight: Successful apps embed monetization into their product design from day one. Apps that optimize onboarding, retention, AI-driven personalization, and hybrid revenue streams are the ones that will scale profitably in 2026’s $1.2 trillion global app market.

More Related Guides: