Best Shopify Alternatives: Top E-commerce Platforms Compared for 2026

Shopify powers millions of online stores, but it’s not the perfect fit for every business, especially in 2026. Rising transaction fees, heavy app dependency, limited B2B features, and escalating scaling costs are prompting many merchants to explore other options.

This guide breaks down the best Shopify alternatives, including BigCommerce, WooCommerce, Wix, Squarespace, Shift4Shop, and Adobe Commerce. We provide honest comparisons on pricing, SEO, scalability, and control, helping you choose a platform that truly grows with your business.

TL;DR – Shopify Alternatives at a Glance

  • Shopify is beginner-friendly but can get expensive and limiting as businesses grow.
  • BigCommerce: Best for scaling brands, no transaction fees, strong B2B features, and advanced SEO.
  • WooCommerce: Best open-source option, full control, unlimited customization, ideal for SEO-driven businesses.
  • Wix: Design-first platform, perfect for creatives and visually stunning stores.
  • Squarespace: Great for creators and membership/subscription brands.
  • Shift4Shop: No monthly fees if using Shift4 Payments, good for startups and seasonal sellers.
  • Adobe Commerce: Enterprise-level flexibility and scalability, best for complex operations.
  • Choosing the right platform depends on growth stage, costs, B2B needs, and long-term flexibility.
  • Working with an e-commerce partner like AppVerticals ensures a smooth platform migration and smarter decisions.

What Is Shopify & Why Businesses Look for Alternatives

Shopify is a hosted e-commerce SaaS platform that lets anyone launch an online store without worrying about servers, security, or maintenance. It handles hosting, payments, inventory, checkout, and apps under one roof, which is why it’s often the first platform entrepreneurs choose. But here’s the trade-off: Shopify prioritizes simplicity over flexibility. As businesses grow, many discover that:

  • Essential features require paid apps
  • Transaction fees add up fast
  • Checkout and backend customization is limited
  • Advanced B2B functionality lives behind Shopify Plus pricing

Merchants usually start exploring Shopify alternatives when costs scale faster than revenue or when platform limitations block growth.

This is where working with an e-commerce consulting partner like AppVerticals’ ecommerce development team helps businesses evaluate platforms based on total cost of ownership, not just monthly fees.

Is Shopify Still Worth It in 2026?

Short answer: Yes, for some businesses. Not for all. Shopify remains a strong choice if you:

  • Are launching your first store
  • Want the lowest learning curve
  • Sell simple products via a B2C model
  • Use Shopify Payments exclusively

shopify alternatives

However, the e-commerce market has matured. According to 2025 ecommerce market share data, WooCommerce powers ~39% of online stores globally, while Shopify holds under 20%. That shift reflects a growing demand for control, SEO flexibility, and predictable costs. Shopify starts to lose value when:

  • You process $50K+ per month
  • App subscriptions exceed $200/month
  • You need B2B pricing, quotes, or account hierarchies
  • International expansion becomes complex

For growing brands, Shopify often becomes a temporary stop, not a long-term home.

Best Shopify Alternatives in 2026

As e-commerce evolves, businesses are re-evaluating platforms that better support growth, flexibility, and cost efficiency. Below are the best Shopify alternatives in 2026, selected based on scalability, pricing transparency, customization, and long-term performance.

1. BigCommerce: Best Shopify Alternative for Scaling Brands

If Shopify is beginner-friendly, BigCommerce is growth-friendly. It removes one of Shopify’s biggest pain points: transaction fees, while offering many enterprise-grade features natively, which reduces reliance on paid apps.

BigCommerce stands out for its zero transaction fees on all plans, built-in B2B capabilities like customer groups, price lists, and quotes, multi-storefront support, advanced SEO controls, and access to over 130 native payment gateways.

Pros

  • Zero platform fees on sales
  • Strong SEO and performance
  • Excellent for omnichannel selling
  • Enterprise-ready without
  • Shopify Plus pricing

Cons

  • Smaller theme marketplace
  • Slightly steeper learning curve
Best for: Brands doing $500K–$50M annually that want predictable costs and scalability.

2. WooCommerce: Best Open-Source Shopify Alternative

WooCommerce isn’t just a platform; it’s a framework. Built on WordPress, WooCommerce gives businesses complete ownership of their store, content, and data. This flexibility is a major reason it powers the largest share of e-commerce sites globally.

Businesses choose WooCommerce for its lack of platform or transaction fees, unlimited customization options, best-in-class SEO capabilities, and seamless integration between content and commerce.

Pros

  • Free core software
  • Full code access
  • Massive plugin ecosystem
  • Ideal for content marketing

Cons

  • Requires hosting management
  • Plugin conflicts need oversight
  • Performance depends on hosting quality
Best for: SEO-driven businesses, publishers, developers, and brands that want long-term control. AppVerticals frequently builds custom WooCommerce solutions for businesses that want Shopify-level usability with enterprise flexibility.

3. Wix: Best for Design-First Online Stores

Wix excels where Shopify feels rigid: design freedom. With drag-and-drop editing and hundreds of templates, Wix lets non-technical users create visually striking stores quickly.

Pros

  • Stunning templates
  • No transaction fees
  • Easy setup
  • Ideal for creatives

Cons

  • Limited scalability
  • Sales caps on plans
  • Fewer advanced e-commerce features
Best for: Boutiques, artists, fashion brands, and local businesses.

4. Squarespace: Best for Creators & Membership Brands

Squarespace blends content, commerce, and subscriptions better than most platforms. It’s ideal if products support your brand, not the other way around.

Pros

  • Premium design quality
  • Built-in memberships and paywalls
  • Strong for digital products

Cons

  • Limited ecommerce depth
  • Less SEO flexibility than WooCommerce
Best for: Course creators, photographers, consultants, and subscription brands.

5. Shift4Shop: Best Shopify Alternative With No Monthly Fees

Shift4Shop flips the SaaS model entirely. If you use Shift4 Payments, the platform itself is free.

Pros

  • $0 monthly fee
  • Strong SEO tools
  • Unlimited products

Cons

  • Locked into Shift4 Payments
  • Older UI and themes
  • Smaller app ecosystem
Best for: Startups and seasonal sellers with tight margins.

6. Adobe Commerce (Magento): Best for Enterprise Custom Builds

Adobe Commerce is for businesses that outgrow platforms altogether. It’s powerful, flexible, and expensive, but unmatched for complexity.

Pros

  • Unlimited customization
  • Robust B2B workflows
  • Global scalability

Cons

  • Six-figure investment
  • Requires dedicated dev teams
  • Overkill for SMBs
Best for: Enterprises with $10M+ revenue and complex operational needs.

Your store has grown. Your platform should too.

Reduce app overload. Eliminate unnecessary fees. Build an e-commerce stack that supports real growth.

Who Should Leave Shopify (And Who Shouldn’t)

You Should Leave Shopify If: 

  • You process $50K+/month
  • App costs exceed $200/month
  • You need B2B features
  • International expansion is complex

You Should Stay If:

  • You’re under $25K/month
  • You rely heavily on Shopify POS
  • Your store is already deeply customized

shopify alternatives

The Takeaway

There is no single “best” e-commerce platform, only the right one for your current growth stage. Shopify is an excellent starting point, but when it begins to feel limiting, expensive, or rigid, that’s not failure; it’s progress.

This is why many growing brands start exploring Shopify alternatives that don’t tax success, reduce dependence on third-party apps, and support long-term flexibility. If you’re considering a move, working with an experienced e-commerce partner like AppVerticals can help you choose, build, and migrate to the right platform without costly mistakes.

Odoo vs SAP: Which ERP is Right for Your Business in 2026?

Odoo is better for faster, lower-cost, and modular ERP adoption, while SAP is better for large enterprises requiring deep process standardization, global scale, and long-term operational control.

SAP continues to lead the enterprise ERP space, while Odoo has gained strong traction among SMEs and mid-market businesses due to its flexibility and lower implementation barriers. In practice, ERP decisions often hinge more on complexity tolerance and transformation capacity than on features alone.

In this guide, I’ll break down the key factors you need to know: cost, customization, scalability, and my advice on which direction to go.

Key Takeaways:

  • Cost Efficiency: Odoo offers transparent pricing, while SAP’s pricing is complex and custom.
  • Implementation Speed: Odoo deploys faster with phased rollouts; SAP requires longer implementation times.
  • Customization Flexibility: Odoo is highly customizable and API-accessible (with the Custom plan); SAP offers customization but with more complexity.
  • Scalability: Odoo scales for smaller operations; SAP is built for large-scale, global enterprises.
  • Support Options: Odoo has community-driven support with premium options; SAP provides enterprise-level support and proactive guidance.
  • Integration: Odoo offers API integrations (Custom plan); SAP provides a structured, enterprise-grade integration suite.
  • Best for Small Businesses: Odoo is perfect for small businesses needing flexibility and cost transparency; SAP suits large enterprises with complex needs.
  • Big Enterprise Benefits: SAP offers better scalability and support for large enterprises, while Odoo works well for specific business needs within large companies.

Odoo vs SAP: A Quick Overview

odoo vs sap

Odoo is an ERP suite designed for modular adoption, allowing businesses to implement one app at a time. With 15 million users, 6,000+ employees, and 16,000+ partners, it serves everyone from startups to large enterprises, offering a flexible, scalable ecosystem. If you’re considering Odoo for your business, working with an experienced Odoo development company can significantly streamline the process.

SAP (S/4HANA) is considered a top-tier ERP for large enterprises, particularly those with $750M+ in revenue. It’s recognized as a Tier I ERP by Panorama Consulting, making it ideal for complex organizations needing deep control and process governance.

So, the real question isn’t which is better? But which model suits your business? Odoo rewards speed, modular adoption, and flexible customization, while SAP excels at standardization, enterprise control, and rigorous process governance.

Let’s take a look at quick decision-matrix:

Criteria Odoo SAP
Best For Small to medium enterprises, phased modular rollouts Large enterprises, global scale, complex governance
Cost Transparency Clear, predictable pricing with flexible plans Complex pricing, often requires custom quotes
Speed of Implementation Fast deployment, can start with core apps and expand Longer timelines, often requires enterprise-level planning
Customization Flexibility High flexibility with modular customization (Custom plan) Strong customization but with higher complexity and cost
Integration Capabilities API access on Custom plan, external integrations easy Integration Suite for seamless, enterprise-grade integrations
Support Community-driven support with paid options Enterprise-level support, with optional premium guidance (Preferred Success)
Scalability Excellent for operational scalability in specific business units Built for enterprise-scale, global standardization, and complex environments
Governance & Control Lower control but flexible for evolving business needs Strong governance, compliance, and process standardization

 What Is Odoo?

what is odoo

Odoo is a modular ERP suite covering core functions like finance, sales, inventory, HR, and more. It comes in two editions: Odoo Community (open-source) and Odoo Enterprise (licensed). Whether you’re looking to implement Odoo CRM or the entire suite, the Odoo implementation process is designed to scale with your business needs.

The key takeaway here is flexibility, Odoo allows businesses to start small (e.g., CRM + invoicing) and expand as needed, without the hassle of re-platforming. It also offers a broad range of apps, with contributions from both the core team and the community.

Tired of Overly Complex ERP Systems?

Switch to a simpler, adaptable platform built for real operational agility.

Discover Odoo ERP

What Is SAP?

what is SAP

SAP, in this context, refers to SAP S/4HANA, a powerful ERP designed for large-scale finance, supply chain, and manufacturing operations. It’s considered a Tier I product, ideal for large enterprises requiring strict governance and process control. SAP’s focus is on enterprise-grade functionality and scalability.

The main difference? Odoo encourages iteration and customization, while SAP expects you to align with standard processes and manage change through formal programs. Neither approach is universally better, but depending on your organization’s appetite for governance and transformation, one may fit better than the other.

What are the Key Differences in Cost between Odoo and SAP?

When it comes to cost, ERP decisions get real. Generally, ERP spend breaks down into four areas: subscription/licensing, implementation, integration, and ongoing change (enhancements + support).

Odoo implementation cost is highly transparent. In the U.S., Odoo Standard costs $31.10/user/month (billed yearly) or $38.90 monthly, while Odoo Custom is $61.00/user/month (yearly) or $76.20 monthly.

The Custom plan is essential for multi-entity setups or integration-heavy projects, as it includes Odoo Studio, Multi Company, and External API access, key features for complex deployments. Notably, external API access is limited to the Custom plan, which is a crucial cost driver for those planning integrations with BI, data warehouses, or legacy systems.

On the SAP side, pricing varies based on scope, user types, packages, and agreements, making it harder to pin down. However, SAP’s Integration Suite follows a tenant subscription model for integration costs.

What many teams overlook is that ERP costs go beyond just software, implementation often drives up costs significantly. Panorama’s 2024 ERP data shows the median project cost is $450,000, with an average duration of 15.5 months, a reminder that execution and organizational change can exceed the first-year software subscription.

Let’s take a quick look at the cost breakdown:

Cost Component Odoo: What Typically Drives It SAP: What Typically Drives It CFO/CTO Note
Subscription/Licenses Standard vs. Custom; Custom needed for API/multi-company/studio Packaged subscriptions + user models; varies by deal/package Treat as “entry ticket,” not total cost.
Implementation Partner scope, data migration, customization Program scale, process standardization, change management Benchmark against median $450K / 15.5 months
Integration API availability (Custom plan) iPaaS strategy, Integration Suite as common layer Integration scope often silently expands budget
Support Ecosystem-based support (varies by approach) Enterprise Support + optional Preferred Success Support models impact risk and internal headcount

Get a Custom Odoo Implementation Quote

Discover how Odoo’s flexible pricing can be tailored to your unique business needs. Our team will provide a personalized quote based on your specific requirements.

Get Your Custom Quote Now

What are the Key Customization Features of Odoo vs SAP?

When explaining customization, I break it down like this: Odoo is easier to customize early on, while SAP is safer to govern at scale, if you follow the platform’s rules.

odoo vs sap customization features

Odoo Customization Options (how we use it at AppVerticals):

  • Odoo Studio: Low/no-code customization for adding fields, changing views, automating workflows, available in the Custom plan.
  • Custom Modules/Code: For complex cases, like manufacturing or accounting, where Studio’s limits are reached.
  • External API Integration: Connects BI, mobile apps, portals, or legacy systems, only available on the Custom plan.
  • Edition Flexibility: The choice between Community vs. Enterprise impacts long-term maintenance strategy.

SAP Customization/Extensibility (how it’s typically managed):

  • SAP Integration Suite: Platform-style integration for connecting SAP and non-SAP systems.
  • Enterprise Support Structures: Governed change through structured support programs and service plans.
  • Preferred Success: Proactive release guidance and enhanced SLAs for cloud ERP journeys.
My Practical Advice: If speed and iteration matter most to your competitive advantage, Odoo’s customization capabilities are compelling. However, if global standardization, auditability, and strict controls are key, SAP’s ecosystem and governance model often provide the edge, though expect more program overhead.

Which ERP is better for Small Business?

For small businesses, Odoo often wins on time-to-value and cost transparency, as long as the scope remains realistic. Its published pricing makes budgeting clear, start with Standard pricing and upgrade to Custom when you need multi-company support, Studio, or API integration. This upgrade path is key because many small businesses don’t need deep integration upfront, but want the option as they grow.

A common problem for small businesses is assuming the ERP’s sticker price is the total project cost. According to Panorama, the median ERP project cost is $450,000, with an average duration of 15.5 months, numbers that can be out of reach for many SMBs if they aim for an enterprise-style rollout.

Here’s my recommendation for small businesses:

  • Choose an ERP that allows phased adoption without needing a perfect enterprise blueprint from day one.
  • Stick to core functions like finance, order-to-cash, and procure-to-pay before diving into customization.
  • If you know you’ll need integrations (e.g., warehouse automation, BI, custom apps), plan for Odoo Custom upfront, as API access is only available with this plan.

While SAP can be a good fit for small businesses in specific cases (e.g., regulated industries or strict governance), it’s rarely the default unless there’s already a broader SAP ecosystem decision at the group level.

What Are the Pros and Cons of Odoo vs SAP for Large Enterprises?

Large enterprises typically choose ERP systems to reduce operational variance, gain more control, and scale reliably, not just for features.

pros and cons of odoo vs sap

Why SAP is Often Chosen for Large Enterprises

SAP S/4HANA is a Tier I ERP, ideal for complex environments like multi-entity consolidation, global process governance, and compliance-heavy operations. Its support structure is tailored for large enterprises, with Enterprise Support included in every cloud subscription, ensuring robust assistance.

Where Odoo Can Fit in the Enterprise

Odoo, while often associated with smaller companies, is also used by large enterprises. It works well for specific business lines, subsidiaries, or when a phased, modular rollout is preferred over a single large-scale transformation. Odoo’s flexibility makes it suitable for enterprises looking for speed and cost transparency in certain areas.

Trade-offs for Your Board/C-Suite

Odoo offers faster deployment and greater cost transparency but requires careful discipline around customization and integration, especially as API access is restricted to the Custom plan.

SAP tends to have higher program overhead but excels in environments where governance, auditability, and standardized global execution are top priorities.

How Does Odoo vs SAP Compare in Terms of Scalability and Flexibility?

I break scalability into two categories: technical scalability (users, transactions, uptime) and organizational scalability (expanding to new countries, entities, and business units without chaos).

Odoo: Flexible, Modular Scalability

Odoo’s strength lies in its flexibility, with a one app at a time approach that suits businesses of all sizes, from startups to large enterprises. This modularity makes it easy to start small (e.g., CRM + invoicing) and scale up as the business grows (e.g., adding inventory, HR, manufacturing).

However, this flexibility comes with a cost: you need strong architectural discipline. As soon as you integrate custom apps, analytics, or external APIs, you’ll need the Custom plan, something many businesses overlook early on, leading to rework and frustration.

SAP: Scalable Execution with Enterprise Guardrails

SAP’s scalability comes from its ecosystem maturity and robust enterprise guardrails. The Integration Suite serves as a unified layer to connect SAP and third-party systems, making integration a permanent capability at enterprise scale.

As enterprises adopt more cloud-based solutions, scalability becomes easier, with SaaS enabling flexibility, modern capabilities, and seamless data integration. Panorama notes the growing preference for cloud as it supports enterprise scalability while offering flexible data access.

My Decision Rule
• If you need maximum flexibility and can enforce a clean customization strategy, Odoo offers excellent operational scalability.
• If you need strong governance and predictable controls across multiple regions and business units, SAP provides safer scalability, but it comes with higher investment in program management and process alignment.

Scale Your Business with Odoo

Learn how Odoo can grow with your business. Our experts will help you integrate a scalable ERP solution that adapts to your future needs.

Contact Us to Learn More

How Do Odoo and SAP Integrate with Other Systems?

Integration is where ERP ROI is either captured or lost.

Odoo Integrations (Practical Reality)

Odoo offers external connectivity via APIs (XML-RPC and similar), but it’s important to note that API access is only available on the Custom plan.

This means that for a CTO, integration strategy and licensing must go hand-in-hand, especially if you’re planning for BI pipelines, middleware, or custom app development. Without the Custom plan, integration capabilities are limited, which can be a critical cost consideration.

SAP Integrations (Platform Approach)

SAP takes a more structured, platform-driven approach with its Integration Suite, a unified platform designed to connect SAP and third-party applications, processes, and data.

SAP also provides clear pricing for the Integration Suite, allowing you to model integration as a defined line item, rather than burying it under “hidden consulting” costs. This ensures better transparency and budgeting for large-scale integrations.

What I Recommend You Budget for Either Way:
Canonical Data Model & Ownership Rules: Ensure clear rules for finance master data, product, and customer data.
Integration Monitoring & Error Handling: Don’t just ensure it connects, plan for proactive monitoring and error management.
Release Strategy: Integrations can break when ERP customizations change or cloud releases update. Treat integration as a product, not a project.

 What Support Options Are Available for Odoo vs SAP?

Support is about more than just tickets, it’s about how risk is managed when your business is live.

  • Odoo Support & Community Model

    Odoo’s support includes email access (24/5 on weekdays in multiple languages) and free upgrades. The Odoo Community Association (OCA) plays a key role by promoting collaboration and creating lower-cost, high-quality solutions faster through community-driven development.

  • SAP Support Model

    SAP offers Enterprise Support with every cloud subscription, providing structured support channels like a knowledge base, cases, expert chat, and community forums. For a more proactive approach, SAP Preferred Success includes targeted release guidance, enhanced SLAs, and access to customer success experts.

Executive-Level Translation:
• If you’re looking for a self-directed ecosystem with a strong community focus (and are comfortable managing partner quality), Odoo is a solid fit.
• If you require a formalized enterprise support structure with premium guidance layers, SAP is better suited for large organizations running mission-critical operations.

Conclusion

If I had to summarize Odoo vs SAP in one line: Odoo optimizes for modular speed and cost transparency; SAP optimizes for enterprise governance and standardized scale.

For investors, the key takeaway is to treat implementation + integration as major cost categories, not afterthoughts. Panorama’s benchmarks, $450,000 median project cost and 15.5 months median duration, offer a useful reality check against overly optimistic projections.

For CTOs, it’s crucial to note that Odoo’s External API access requires the Custom plan, which can significantly impact both your budget and integration strategy.

If you’d like to explore how Odoo ERP can fit your needs, AppVerticals specializes in Odoo ERP development and can help tailor a solution that scales with your business.

If you share your company’s size (revenue, users), number of legal entities, countries, and any plans for custom app development or deep BI integration, I can help you build a 3-year cost model and decision matrix specific to your situation, without assumptions.

Ready to Transform Your Business with Odoo?

Take the next step towards a more efficient, scalable, and cost-effective ERP solution with Odoo.

Get Started with Odoo Today

Telemedicine Statistics 2026: Key Data Investors Need to Know for Software & App Opportunities

Telemedicine has evolved far beyond its initial role as a pandemic stopgap, establishing itself as a permanent and transformative care channel, with telehealth utilization stabilizing at ~38× pre‑pandemic levels, even after the initial surge subsided.

For healthcare leaders and investors, telemedicine statistics reveal how this innovation is reshaping the way health systems attract patients, manage chronic conditions, and optimize clinical capacity.

As telemedicine continues to expand, this article will explore key growth areas within telemedicine, virtual care platforms, and remote patient monitoring (RPM). By leveraging telemedicine statistics and data-driven insights, we’ll highlight the most promising investment opportunities and provide guidance on where to allocate resources in this rapidly expanding market.

Key Takeaways:

  • Market Growth: Telemedicine market to grow from $141.19B in 2024 to $380.33B by 2030 (55% CAGR), with telehealth reaching $455.27B (68% CAGR).
  • Expanding Scope: Telemedicine focuses on clinical visits, while telehealth includes virtual visits, RPM, and digital engagement, offering a larger investment opportunity.
  • Adoption Drivers: Cost pressures, capacity constraints, and remote care demand, with EHR and cloud integration enhancing scalability.
  • Regional Trends: North America leads in commercialization, Europe in policy-driven adoption, and APAC in government-led initiatives.
  • Behavioral Health: Mental health services dominate telemedicine, comprising 66-67% of claims in late 2024.
  • Financial Impact: ROI comes from time and travel savings, with $250B of U.S. healthcare spend potentially shifting to virtual care.
  • Future Outlook: Hybrid care, chronic care with RPM, and AI-driven innovations will shape the future, optimizing efficiency and cost.

Telemedicine Market Overview: Size, Trajectory, and Why the Software Layer Matters

Telemedicine is a large and rapidly growing market, with strong growth projected through 2030. Market research consistently shows a positive trajectory:

  • The global telemedicine market, valued at $141.19B in 2024, is expected to reach $380.33B by 2030, with a 55% CAGR from 2025 to 2030.
  • The global telehealth market, valued at $123.26B in 2024, is projected to grow to $455.27B by 2030, with a 68% CAGR during the same period.
Investor Takeaway: If you’re confused between telehealth vs telemedicine, Telemedicine generally refers to clinical visits, while telehealth encompasses a broader suite (virtual visits, RPM, and digital engagement). For software investors, the broader telehealth definition aligns more closely with total addressable market (TAM) opportunities.

What Are the Key Factors Driving Telemedicine Adoption?

The key factors driving adoption include:

key drivers of telemedicine adoption

  • Cost Pressure & Capacity Constraints: Telehealth serves as a lever to increase throughput.
  • Remote Care Expectations: Consumers now expect convenience through remote care.
  • EHR Integration & Cloud Delivery: Virtual care is becoming operationally scalable, moving from a “bolt-on” solution to a fully integrated part of care delivery.

Telemedicine is increasingly integrated into electronic health record (EHR) workflows and hybrid care models, shifting away from being viewed as a standalone service. This integration is a major catalyst for APIs, identity management, scheduling tools, documentation, and revenue-cycle solutions.

Regional Adoption Trends:

  • North America: The region accounted for 36% of global telemedicine revenue in 2024.
  • Europe: Telehealth is widely adopted, with 84% of countries offering teleradiology, 77% providing telemedicine or RPM, and 51% delivering telepsychiatry.
  • India/APAC: India’s government-led eSanjeevani platform facilitated over 163 million consultations (Nov 2019–Sep 2023), with provider-assisted sessions accounting for more than 93% of usage.
Investor Takeaway: Europe’s growth is driven by system-led strategies, national policies, and reimbursement models. In APAC, there’s a combination of government-led mega-platform scaling and private sector innovation. North America, however, leads in commercialization, platform integrations, and monetization.

Telemedicine Usage & Adoption: What the Demand Curve Really Looks Like After COVID

Telemedicine adoption has shifted from a temporary solution to a permanent, mainstream care model.

The fear of telemedicine ‘replacing’ traditional care models is unfounded. Instead, it’s acting as a ‘force multiplier.’ The future belongs to hybrid models that blend digital convenience with in-person care. Clinics offering both physical and telemedicine services saw a 12% increase in total volume, adding 2 additional telemedicine visits and 2 more in-person visits daily on average. This underscores the significant growth opportunities for operators who integrate virtual care with their physical practices. – Alan A. Ayers, MBA, MAcc, President of Urgent Care Consultants and Senior Editor of The Journal of Urgent Care Medicine. 

Let’s explore the trends in provider adoption, utilization patterns, and key areas driving sustained demand post-COVID:

telemedicine adoption trends

Provider Adoption: Telemedicine Is Now Mainstream

One of the most telling signs of telemedicine’s long-term potential is its widespread adoption among healthcare providers. In the U.S., the share of office-based physicians using telemedicine for patient care surged from 16.0% in 2019 to 80.5% in 2021. This isn’t just “pilot” adoption; it reflects a significant shift in institutional behavior.

Utilization Is Lower Than Peak, But Stable

Although telemedicine utilization has dipped from its pandemic peak, it remains consistently higher than pre-COVID levels. According to FAIR Health, U.S. telehealth utilization rose from 4.74% of medical claims in July 2024 to 5.04% in December 2024.

The Biggest Sticky Use Case: Behavioral Health

Behavioral health continues to be the dominant use case for telemedicine. Between July and December 2024, mental health conditions accounted for 66-67% of telehealth claim lines, solidifying it as the most persistent and in-demand telehealth service.

Investor Takeaway: Behavioral health remains a strong anchor for telemedicine demand, though competition is fierce. Differentiation often hinges on improving workflows, outcomes, and payer relationships, rather than just offering video consultations.

Rural Access: A Gap and Product Opportunity

Data from AHRQ/MEPS reveals a persistent gap in telehealth access between metropolitan and nonmetropolitan areas. For mental health providers, telehealth adoption was 48.9% in metropolitan areas, but only 26.3% in nonmetropolitan areas. This gap presents a significant product opportunity for telehealth solutions designed for low-bandwidth or hybrid modalities.

Investor Takeaway: Solutions that minimize friction in rural areas, such as audio-first, asynchronous care, low-data UX, and device lending programs, are essential for meeting access targets and controlling costs.

Financial Impact & Investment Opportunities: Where ROI Shows Up (and Where It Doesn’t)

The financial impact of telemedicine goes beyond basic cost savings. Let’s explore the most defensible ROI opportunities, the broader virtualization potential, and the latest healthcare software development trends that are shaping the market.

While telemedicine app development costs can be substantial, healthcare app development cost is an important consideration when evaluating the ROI of telemedicine. the ROI of telemedicine is most effectively realized through indirect savings, particularly from reductions in time, travel, and missed work, as well as improvements in operational efficiency. Rather than direct revenue generation, these factors contribute significantly to long-term cost reductions, making the financial benefits more defensible.

A notable economic evaluation in oncology found that:

  • Telehealth visits saved an average of $147–$186 per visit.

  • For new or established visits, savings ranged from $176.6 to $222.8, depending on mileage and travel distances.

Investor Angle: For those investing in telemedicine app development, focusing on solutions that enhance telehealth appropriateness will drive further ROI. Key features you can work on includes, better triage and routing, device integration, and streamlined documentation. These enhancements will increase virtual visit frequency, drive repeatable savings, and ultimately enhance the ROI of your telemedicine app, making it a worthwhile investment for healthcare organizations.

The Macro Virtualization Opportunity

McKinsey estimates that up to $250B of U.S. healthcare spend could potentially shift to virtual or virtually enabled care. This figure serves as a useful benchmark for investors, signaling the size of the opportunity if workflows and reimbursement frameworks align.

While this is not a guarantee, it sets a clear boundary on the potential size of the market.

Venture Funding Signals: Capital Is Still Flowing (But Differently)

Although digital health funding has cooled since the 2021 peak, capital is still being invested, particularly in AI-driven operational tools. In 2024, U.S. digital health venture funding totaled $10.1B across 497 deals.

Technology and Platforms behind Telemedicine: Where Critical Software Features Are Built

Telemedicine platforms are evolving quickly, with cloud delivery and seamless integration becoming standard. Here’s how the key technologies are driving growth, expanding RPM market, and the critical software features that make platforms scalable and secure.

Telemedicine Platforms Are Scaling, Cloud and Integration Are Now Baseline

As these platforms expand, telemedicine app features like cloud-based delivery and seamless integration are becoming essential for scalability and efficiency. According to Grand View Research, the telehealth software market is experiencing strong growth, driven by the increasing demand for healthcare IT solutions and cloud-based infrastructure.

Remote Patient Monitoring (RPM): A High-Growth Adjacent Market

RPM is becoming an integral part of virtual care programs, especially for chronic diseases, hospital-at-home, and post-acute care. The RPM market is projected to grow from $27.72B in 2024 to $56.94B by 2030, reflecting a 12.7% CAGR.

Security & Compliance: A Core Product Feature

For U.S.-based platforms, HIPAA compliance is non-negotiable. HHS telehealth guidance sets the standard for both product design and vendor selection, ensuring platforms meet privacy and security requirements.

Software Opportunity Areas: Where Budgets Move

Key areas of investment in telemedicine software include:

Telemedicine Software Opportunities

  • EHR Integration (Epic, Oracle Health, Cerner): Integration with major EHR systems allows seamless sharing of patient data across different care settings, improving coordination and reducing administrative tasks.
  • Identity Management, Consent, and Audit Trails: Robust systems for verifying patient identities, securing consent, and maintaining audit trails ensure privacy, security, and compliance with regulations like HIPAA.
  • Scheduling and Intake Automation: Automating scheduling and patient intake processes streamlines workflows, reduces errors, and improves the overall patient experience by minimizing wait times.
  • Clinical Documentation Tools: Advanced tools for clinical documentation help healthcare providers capture accurate, real-time data, ensuring better record-keeping and reducing administrative burden.
  • Claims and Reimbursement Optimization: Software that automates claims processing and reimbursement workflows helps reduce errors, speed up payment cycles, and ensure accurate billing.
  • Multi-Modality Solutions (Video, Audio, Asynchronous Messaging): Multi-modality solutions support a variety of communication channels, enhancing flexibility and accessibility for both patients and providers, improving engagement and care delivery.

Patient & Provider Satisfaction: The Stickiness Metrics Investors Should Track

Patient Satisfaction: High, But Inconsistent (Room for UX Improvements)

Patient satisfaction with telehealth services is generally positive but varies by provider. J.D. Power reports:

Telehealth Type Satisfaction Score (out of 1000) Year-over-Year Change Barrier Percentage
Direct-to-consumer Telehealth 730 Down 1 point
Payer-provided Telehealth 708 Up 18 points
Patients Facing Barriers 65%
Investor Takeaway: The key to improving telehealth user experience isn’t flashy video features, it’s reliability, speed, trust, and ensuring a comprehensive experience (labs, prescriptions, follow-up care, and navigation).

Provider Sentiment: Telemedicine Is Now Part of Routine Practice

A 2024 Doximity report shows broad clinician support for telemedicine:

  • 77% of physician users engage in telemedicine at least weekly (35% daily).
  • 83% want telemedicine to remain a permanent part of their practice.
  • 96% of patients felt telemedicine care was equivalent to or better than in-person visits.

Challenges & Regulatory Landscape: The Risk Factors Investors Must Underwrite

Though this is the best time to invest in telemedicine, there sure are some areas you must consider when taking the final decision, they include:

risk factors in telemedicine investmnet

Reimbursement and Policy Timing Still Matter (U.S.)

Medicare remains a critical policy driver for telehealth adoption. CMS has extended telehealth flexibility for Medicare beneficiaries through January 30, 2026, with changes starting for non-behavioral services on January 31, 2026.

Access & Infrastructure: Rural Disparity Remains

AHRQ data highlights the rural/metro gap in telehealth access, particularly for mental health services.

Governance & Evaluation: A Global Gap in Telehealth Assessment

Only 37% of European countries report evaluating their telehealth services, according to the WHO Europe survey. This indicates a significant gap in measurement and outcomes tracking.

Investor Takeaway: Measurement and reporting is more than just compliance, it’s a product differentiator. Health systems and payers are increasingly seeking data on outcomes and cost-effectiveness, especially as reimbursement policies tighten.

The Future of Telemedicine: Where Growth Concentrates Next

Telemedicine is no longer just a stopgap measure. By 2026, it has solidified its place as a core, multifaceted component of healthcare delivery. This transition reflects not only widespread adoption but a rethinking of how technology can drive efficiency and continuity of care across patient and provider touchpoints.

Telemedicine Is Evolving into Virtual-First + Hybrid + Home Care

Telemedicine is transitioning from a niche solution to a central pillar of healthcare delivery. The most promising growth areas are in care models supported by advanced software rather than just video visits. For developers and healthcare providers, understanding these emerging trends is crucial, and a solid telemedicine app development guide can help ensure your platform remains adaptable and competitive.

Mansor Abu Hussain, Director at Alhijrah Urgent Care Centre, highlights that telemedicine adoption is no longer a temporary measure but an essential part of modern healthcare infrastructure. As noted in his paper “Telemedicine Adoption: A Concept Analysis,” presented at the 7th International Conference on Business, Social and Technology 2026, “Telemedicine has evolved into an integral pillar of healthcare systems, creating both efficiency and continuity in care routines.” He points to this sustained integration as key to achieving optimal outcomes across diverse patient populations.

Key Trends to Watch:

  1. Hybrid Care Pathways: The integration of virtual and in-person care is becoming the norm. This model ensures continuity and flexibility for patients while optimizing resource utilization for providers.

  2. Chronic Care Programs with RPM: Remote Patient Monitoring (RPM) is increasingly bundled with chronic care management programs, enabling better long-term management of conditions like diabetes, hypertension, and cardiovascular diseases. These programs are poised to scale as patients seek ongoing, remote care.

  3. Behavioral Health at Scale: Behavioral health remains one of the highest growth sectors in telemedicine, with mental health services delivered remotely continuing to dominate the telehealth landscape. The demand for virtual mental health services is only expected to increase, especially as stigma decreases and access improves.

  4. Digital Front Doors: Patient access points, whether through apps, portals, or virtual assistants, are becoming the first step in the healthcare journey. Digital front doors will streamline patient routing, ensuring they are directed to the appropriate level of care (virtual or in-person) based on their needs.

According to Mansor, AI technologies will also play a critical role in making these new models more efficient. He states, “By leveraging AI-driven tools, the future of telemedicine will empower healthcare systems to become more data-driven, improving everything from triage to chronic care management.”

Conclusion

Telemedicine has demonstrated its ability to scale, physician adoption in the U.S. surged from 16% to 80.5%, and utilization remains strong, with telehealth claim lines consistently around 5% in late 2024 (commercial claims data).

For investors, CFOs, and CTOs, the real opportunity lies not in funding another telemedicine app but in backing the infrastructure and workflow-native platforms that will shape the future of healthcare. The most promising areas for investment include platforms that:

  • Reduce Friction: Streamlining intake, routing, documentation, and follow-up processes to make telemedicine more efficient for both patients and providers.
  • Expand Access: Developing solutions for underserved regions, including rural areas, and offering low-bandwidth or hybrid modalities.
  • Improve Outcomes Reporting: Enhancing tracking and reporting to ensure that telemedicine services meet reimbursement standards and support long-term contracts.
  • Integrate Deeply with EHR and Cloud Ecosystems: Building platforms that seamlessly connect with existing electronic health record systems and cloud infrastructure for better data flow and operational efficiency.

The macroeconomic potential remains substantial, up to $250B of U.S. healthcare spend could shift to virtual or virtually-enabled care if care pathways continue to evolve.

Building these advanced, integrated solutions requires expertise in both healthcare and technology. AppVerticals, with its experience in creating tailored, scalable healthcare platforms, is well-positioned to support the development of the next generation of telemedicine solutions.

More Related Guides:

Low Code vs No Code (2026): Which One Should You Actually Choose?

By 2026, more than 70% of new enterprise applications will include components built with low-code or no-code platforms, a structural shift in how software gets delivered in real business contexts.

I’ve evaluated and delivered web apps and custom web development services across SaaS, FinTech, healthcare, and enterprise modernization, and the pattern is consistent: speed alone doesn’t win, like architecture, risk, and long-term scalability do. 

The real question isn’t whether to use low-code or no-code, but where each fits safely inside a modern web stack.

Key Takeaways

  • Low-code vs no-code is an architecture decision, not a tooling one. It defines which parts of your web app you’re willing to abstract or lose control over.
  • No-code prioritizes speed by hiding execution, APIs, and authentication, making it suitable only for short-lived, non-core web apps.
  • Low-code preserves control over logic, data, and integrations, allowing web apps to scale and evolve safely.
  • At $50k, no-code can work if scope and lifespan are tightly constrained.
  • At $100k, low-code becomes safer as APIs, auth, and data models change.
  • At $500k, longevity, security, and exit strategy outweigh delivery speed.
  • Web app modernization and website redesign usually require parallel operation, where legacy and new systems coexist, no-code breaks here.
  • Integration, data, and access control fail before the UI does.
  • Use no-code at the edges, low-code for workflows, and full-stack for the core platform.

Why Low-Code vs No-Code Is Now a Core Web Development Decision

Low-code vs no-code is now a core web development decision because engineering capacity can’t keep up with web product demand, and not every web app problem justifies full custom build anymore.

Over 87% of enterprise developers use low-code in active application delivery workflows, not experiments or side projects.

Low-code accelerates web application development using visual tooling while still exposing code, APIs, and data models, so engineers retain architectural control.

No-code enables web apps through configuration alone, abstracting execution, integrations, and authentication to maximize speed at the cost of control.

The difference matters when scalability, security, integrations, or long-term change become requirements,  not after they break.

From what I see in real web and web-app programs, this decision shows up when teams hit the same wall: backlogs grow, releases slow down, and hiring doesn’t fix it fast enough. Low-code and no-code enter the conversation not as shortcuts, but as delivery pressure valves.


How Do Low-Code vs No-Code Architectures Compare for Web Apps in Scalability, Security, and Control?

Low-code scales web apps by preserving architectural control over data, logic, and integrations, while no-code scales delivery speed by abstracting those layers away. As complexity grows, low-code bends; no-code breaks.

Here’s the simplest way to understand this as a web decision.

A production web app is not a UI problem. It’s an API, identity, and data-flow problem. Most web apps today depend on internal services, third-party APIs, background jobs, and role-based access rules. 

Over 60% of organizations manage more than 100 APIs, which explains why integration control becomes a scaling bottleneck very quickly.

Architecturally, the split is clear:

  • No-code runs your app inside the vendor’s execution model. You configure behavior, but you don’t own how requests are processed, how APIs fail, or how auth decisions are evaluated.
  • Low-code accelerates development, but still exposes logic, integrations, and data models so engineers can intervene when requirements change.

How Do No-Code Web Apps Handle and Fail at Scale, APIs, and Authentication?

No-code web apps handle scale by constraining customization, not by optimizing system behavior.

They work well when:

  • API volume is low
  • Authentication rules are simple
  • Data relationships are shallow

They fail when web apps require:

  • Custom SSO flows or conditional access rules
  • High or unpredictable API traffic
  • Async processing (queues, retries, webhooks)

Authentication is usually the first failure point.

Why Does Low-Code Still Require Full-Stack Engineers for Web Apps?

Low-code reduces how fast you write code, not who owns architectural responsibility.

In real web apps, full-stack engineers are still needed to:

  • Design data models that won’t collapse as usage grows
  • Implement secure authentication and authorization logic
  • Control API orchestration, retries, and failure handling
  • Diagnose performance bottlenecks and edge cases
  • Plan exit paths to avoid vendor lock-in

Low-code accelerates delivery, but engineering judgment still governs scalability, security, and control. Teams that ignore this don’t fail immediately. They fail later, when change becomes expensive.

What Do Web Teams Actually Get at $50k, $100k, and $500k Using Low-Code vs No-Code?

At different budget levels, low-code and no-code don’t just change what you build; they change how long the solution survives before rework, migration, or replacement becomes unavoidable.

In 2026, website design cost is tightly coupled with delivery model, integration depth, and architectural ownership. Budget determines whether you’re buying speed, flexibility, or long-term control, and you rarely get all three.

Here’s how this plays out in real web and web app delivery.

At $50k, teams are buying speed, not architecture. No-code typically delivers faster outcomes here: internal tools, admin panels, simple customer portals, or workflow-driven web apps. 

Low-code and no-code adoption is strongest in departmental and tactical use cases, where time-to-value outweighs long-term extensibility.

At this level, no-code can be the right call, but only if the web app has a clear lifespan and limited integration scope.

At $100k, the trade-off shifts. Web teams start needing:

  • External APIs
  • Custom authentication
  • Data models that evolve

This is where no-code begins to strain, and low-code becomes more viable. Organizations using low-code at scale cite better alignment between delivery speed and architectural control compared to no-code-only approaches.

At this budget, teams often mix low-code with traditional development, accelerating delivery while retaining control over critical web app layers.

At $500k, the conversation changes entirely. This is about platform longevity. Web apps at this level involve:

  • Complex integrations
  • Security and compliance requirements
  • Multi-team ownership
  • Long-term roadmap commitments

Large digital transformation programs fail more often due to execution and architectural rigidity than technology choice, which is why higher-budget teams prioritize flexibility and exit options over raw speed.

At this tier, low-code can still play a role, but no-code is usually relegated to peripheral systems, not the core web platform.

What This Means for Decision-Makers

  • $50k → No-code can be efficient if lifespan and scope are tightly controlled
  • $100k → Low-code offers a safer balance between speed and control
  • $500k → Architecture, ownership, and exit strategy matter more than tooling speed

Budgets don’t just buy features. They buy tolerance for risk and change, and that’s what should guide low-code vs no-code decisions in serious web development.

Not Sure Where Low-Code or No-Code Fits in Your Web Stack?

Most teams fail because they apply them in the wrong places. If you’re weighing low-code, no-code, or full-stack for a real web app, get a second opinion before architecture locks you in.


Get an Architecture Check

How Do Low-Code vs No-Code Perform for Web App Modernization and Legacy Systems?

Low-code supports web app modernization by allowing legacy systems to run in parallel while new components are introduced incrementally; no-code works only when legacy systems can be bypassed or fully replaced. 

In real modernization and website redesign programs, parallel operation is the rule, not the exception. That single constraint explains most success and failure patterns.

Modern web app modernization usually looks like this:

  • The legacy system still handles revenue, users, or compliance
  • New features must ship without breaking existing flows
  • Downtime and forced migrations are unacceptable
  • Multiple systems must coexist for 12–36 months

This is why modernization fails so often. Low-code and no-code behave very differently under these conditions.

How Modernization Actually Works (Simple Mental Model)

Think in layers, not tools:

  • Legacy layer: existing CMS, ERP, auth system, database
  • Transition layer: APIs, adapters, orchestration logic
  • Modern layer: new web UI, workflows, services

Low-code can live in the transition and modern layers. No-code assumes the transition layer is thin or unnecessary. That assumption is where most projects break.

What Integration, Data, and Vendor Lock-In Risks Appear in Legacy Web Platforms?

Modernization fails when one of these three risks is underestimated.

1. Integration risk (breaks first)

Integration Risk in Legacy Platforms

Legacy systems expose APIs that are:

  • Inconsistent
  • Poorly documented
  • Prone to timeouts or partial failures

In no-code platforms:

  • Retry logic is fixed
  • Error handling is opaque
  • Performance tuning is unavailable

In low-code:

  • Engineers can control retries, fallbacks, batching, and throttling
  • Integration logic can evolve without platform dependency

This is the difference between temporary instability and chronic outages.

2. Data risk (kills flexibility)

Data Risk in Legacy Platforms

Modernization almost always requires:

  • Running old and new systems simultaneously
  • Syncing data across models
  • Migrating users gradually

Data integration and data quality as top failure points in modernization, especially when platforms restrict direct access to schemas and transformations.

No-code platforms abstract data models. That speeds initial setup but blocks:

  • Schema evolution
  • Dual-write strategies
  • Controlled migrations

Low-code allows teams to design data as a migration asset, not a liability.

3. Vendor lock-in risk (explodes later)

Why no-code migration fails

This doesn’t show up in month three.
It shows up in year two.

With no-code:

  • Business logic lives inside proprietary runtimes
  • Workflows aren’t portable
  • Exiting means rebuilding from scratch

With low-code:

  • Logic is closer to standard languages and APIs
  • Infrastructure is more transferable
  • Exit paths exist, even if you never use them

Modernization is about optionality, not speed alone.

Modernization Decision Checklist (Use This, Not Gut Feel)

Use no-code if:

  • The legacy system is being fully retired
  • Integrations are shallow and temporary
  • The web app has a fixed, short lifespan

Use low-code if:

  • Legacy systems must coexist for 12–36 months
  • Data models will change over time
  • Security, scale, or compliance requirements will increase
  • You need an exit strategy, even if you don’t plan to use it

Bottom Line for Decision-Makers

  • Low-code aligns with how modernization actually happens, like in layers, over time, with constraints.
  • No-code only works when those constraints don’t exist. That’s the difference.

What Can’t You Reliably Build with Low-Code or No-Code Web Apps?

You can’t reliably build core, long-lived web platforms with complex security models, high-throughput integrations, or evolving business logic using low-code or no-code alone. 

These approaches fail when precision, performance, and change tolerance become non-negotiable.

Here’s why

Modern web apps hit limits when they must coordinate many systems at once. According to Cloudflare, Enterprises increasingly operate hundreds of APIs, which raises the bar for error handling, retries, rate limits, and observability.

Low-code/no-code platforms abstract these mechanics. That’s fine until you need deterministic behavior under load. When you can’t tune timeouts, control concurrency, or inspect failures deeply, reliability degrades in ways teams can’t quickly fix.

Security is another hard stop. The OWASP Top 10 consistently shows that access control and auth logic failures dominate real incidents, not UI bugs.

Constraints Table: Where Low-Code / No-Code Break Down

Requirement Why It Breaks
Complex authentication (custom SSO, conditional access) Limited control over token lifecycles and auth flows
High-volume, bursty API traffic Fixed retries, opaque throttling, weak observability
Asynchronous processing (queues, workers) Poor control over concurrency and failure recovery
Evolving data models Abstracted schemas block safe refactoring
Long-term platform ownership Proprietary runtimes increase exit cost

What This Means for Decision-Makers

Low-code and no-code are effective accelerators, not foundations, for:

  • Core customer platforms
  • Regulated systems
  • Products with multi-year roadmaps

What Are the 5 Best Low-Code Platforms for Serious Web Application Development?

The best low-code platforms are the ones that let teams accelerate delivery without surrendering architectural control or locking themselves into brittle abstractions. “Best” here means survivable under change, not flashy in demos.

Below are five low-code platforms that consistently show up in real web application programs, not just comparison blogs, each for different reasons.

1. OutSystems

Best for: Large-scale, long-lived web platforms

OutSystems is built for enterprises that need performance, scalability, and governance without writing everything from scratch. It works best when teams still want engineers deeply involved but need to compress delivery cycles.

Use it when:

  • The web app is business-critical
  • Integrations are complex
  • Multiple teams ship in parallel

2. Mendix

Best for: Domain-heavy applications and structured workflows

Mendix shines where business rules are complex and need to be modeled clearly. It’s often chosen in manufacturing, logistics, and regulated environments where process clarity matters more than UI polish.

Use it when:

  • Business logic is dense
  • Stakeholders need visibility into workflows
  • Governance and auditability matter

3. Microsoft Power Apps

Best for: Organizations already deep in the Microsoft ecosystem

Power Apps works best when web apps are tightly coupled with Microsoft 365, Azure, and Dynamics. It’s a practical choice for internal tools and workflow-driven apps that don’t need full platform independence.

Use it when:

  • Identity, data, and infra already live in Microsoft
  • The app supports internal or operational use cases
  • Azure integration is a priority

4. Appian

Best for: Process-driven, compliance-heavy web applications

Appian is less about UI freedom and more about process orchestration and governance. It’s strong in finance, healthcare, and government-style workflows where traceability is non-negotiable.

Use it when:

  • Process automation is central
  • Compliance and audit trails matter
  • UI flexibility is secondary

5. Retool

Best for: Engineering-led internal web apps and admin panels

Retool sits close to code and is favored by developers who want speed without losing visibility. It’s not for customer-facing products, but it’s excellent for internal systems that still need reliability.

Use it when:

  • Engineers own the app
  • You’re building admin tools, dashboards, or ops systems
  • APIs and databases already exist

What Are the 5 Best No-Code Platforms and Where Do They Actually Make Sense?

The best no-code platforms are the ones that let teams ship fast in tightly scoped scenarios without pretending to replace real engineering. “Best” here means low blast radius, not long-term architectural strength.

These platforms succeed when the web app is contained, replaceable, and non-core.

1. Bubble

Best for: Fast MVPs and simple customer-facing web apps

Bubble is the most flexible no-code platform for UI-heavy apps, which is why it’s popular with startups testing ideas quickly.

Use it when:

  • You’re validating a product or workflow
  • Scale and performance are secondary
  • The app can be rebuilt later if needed

2. Webflow

Best for: Marketing sites and content-driven web experiences

Webflow excels at frontend control without backend complexity. It’s not an application platform, and that’s exactly why it works.

Use it when:

  • The goal is speed, SEO, and design precision
  • Backend logic is minimal or external
  • The site must be easy to maintain

3. Airtable

Best for: Lightweight internal tools and operational systems

Airtable is powerful when teams need structured data and simple workflows without standing up a full backend.

Use it when:

  • The app is internal
  • Data relationships are simple
  • APIs are limited or controlled

4. Zapier

Best for: Glue logic and automation between systems

Zapier isn’t a web app platform. It’s an orchestration layer. That’s why it works well alongside other tools.

Use it when:

  • You need fast integrations
  • Workflows are event-driven
  • Reliability requirements are moderate

5. Glide

Best for: Simple portals and mobile-first internal apps

Glide is effective for turning structured data into usable interfaces quickly.

Use it when:

  • Users are internal or controlled
  • Logic is shallow
  • The app lifecycle is short

Which Low-Code vs No-Code Platforms Are Best for Specific Web Application Use Cases?

The “best” platform depends entirely on what part of the web app you’re building and how long it needs to live. No-code wins for speed and containment; low-code wins when ownership, integration depth, and future change matter.

Here’s the correct way to think about it.

Platform Fit by Web Application Use Case

Web App Use Case No-Code Fit Low-Code Fit Why
Internal dashboards & admin tools Strong Strong Limited users, predictable logic
Workflow portals (ops, HR, CRM overlays) Strong Strong CRUD + rules-based logic
Customer-facing MVPs Short-term Better MVPs evolve quickly
API-heavy SaaS products Weak Strong Integration control required
Regulated or secure platforms Risky Conditional Security precision needed
Long-lived core web platforms Not suitable Partial Custom code unavoidable

Now let’s break this down clearly.

When Does No-Code Make Sense for Web Apps Like Internal Tools and Portals?

No-code makes sense when the web app is contained, replaceable, and non-core.

Good no-code use cases:

  • Internal dashboards
  • Admin panels
  • Approval workflows
  • Temporary customer portals

Platforms like Bubble, Retool, and Airtable work well here because:

  • Logic is shallow
  • Auth rules are simple
  • Integration scope is limited
  • Exit cost is acceptable

If the app can be rebuilt in 6–12 months without business disruption, no-code is usually fine.

When Is Low-Code the Better Choice for Serious Web Development?

Low-code is the better choice when the web app must grow, integrate, and survive change.

Low-code fits when:

  • APIs are core to the product
  • Authentication and permissions evolve
  • Data models won’t stay static
  • Multiple teams touch the codebase
  • The app is expected to live for years

Platforms like OutSystems, Mendix, and Microsoft Power Apps succeed here because:

  • Logic is still inspectable
  • Integrations are extensible
  • Engineers can intervene when things break

Low-code doesn’t replace serious web development, but compresses the time spent on repeatable work, while custom code still governs the parts that must be precise.

What’s the takeaway 

  • Use no-code to move fast where failure is cheap
  • Use low-code where the web app must evolve safely
  • Use custom development for the core that defines your business

Teams that succeed don’t ask “Which platform is best?” They ask “Which parts of this web app can we afford not to own?”

How Should You Choose Between Low-Code, No-Code, and Full-Stack Web Development?

CTOs should choose based on how much of the web application they can afford not to own and how expensive change will be over the next 24–36 months. 

The wrong choice doesn’t fail immediately, but when requirements change, and this is often the point teams evaluate whether an experienced web app development company is needed to own architecture, security, and integration decisions.

Here’s the decision logic that actually holds up in real organizations.

The mistake most teams make is asking “Which approach is faster?” Speed only matters at the start. The real question is where flexibility, risk, and control must live as the product evolves.

Think of the decision in three layers.

Decision Flow (Use This, Not Gut Feel)

1. Is this web app core to revenue, customers, or compliance?

  • Yes → Full-stack or low-code + custom backend
  • No → No-code or low-code is acceptable

If failure or downtime affects revenue or trust, abstraction becomes a liability.

2. Will the business logic, data model, or integrations change materially within 12–24 months?

  • Yes → Low-code or full-stack
  • No → No-code may be sufficient

Change tolerance is more important than initial delivery speed.

3. Do you need precise control over security, auth, or performance?

  • Yes → Full-stack or low-code
  • No → No-code can work

If you can’t explain how auth, permissions, and data access work, you don’t control them.

4. Can you afford to rebuild this web app later if needed?

  • Yes → No-code is acceptable
  • No → Low-code or full-stack

Exit cost is the hidden variable most teams ignore.

How Strong Teams Actually Combine Approaches

The best teams don’t pick one approach; they compose them:

  • No-code for internal tools, admin panels, temporary portals
  • Low-code for workflow-heavy systems that must integrate and evolve
  • Full-stack for the core platform that defines the business

This hybrid model keeps delivery fast without surrendering control where it matters.

How Can AppVerticals Bring Expertise to Your Projects 

AppVerticals is specialized in custom web application strategy, modernization, and execution that balance speed, control, and long-term scalability rather than chasing buzzwords or shortcuts.

A strong example is our work with Collaborative Patient Care Group (CPCG), where they engineered a secure remote support hub to replace a patchwork of disconnected tools with a unified platform for scheduling, kiosk access, monitoring, and collaboration. 

This project tackled challenges like legacy fragmentation, integration complexity, and the need for precise control without sacrificing delivery pace. 

This kind of work, from legacy system modernization to high-traffic web experiences, exemplifies how AppVerticals helps teams choose and execute the right mix of low-code, no-code, and full-stack strategies based on real constraints, not buzz.

Wrapping it Up

Low-code vs no-code isn’t about speed; it’s about where failure is acceptable. This article showed where no-code breaks (auth, APIs, data, modernization), where low-code still needs engineers, how budgets ($50k–$500k) change outcomes, and why website redesigns fail without parallel architectures. 

Now, for you, the focus is simple: protect the core, accelerate the edges, and plan exits before scale forces them.

Design Your Web Architecture Before It Designs Your Costs

We help teams define ownership boundaries that scale, without locking themselves into the wrong platforms.

Talk to a Web Specialist

Related Guides

Oursource web development 

Angular vs React

Ecommerce web development

Website design Cost

Website redesign cost

Education app development challenges

Mobile App Development Market Growth and Size Statistics: A Comprehensive 2026 Investment Guide

The mobile app development market has experienced exponential growth over the past decade, and 2026 marks a pivotal year for businesses looking to leverage this transformation. If you’ve been on the fence about entering the mobile-first space, now is the time to act.

It’s no longer a question of if mobile apps are a worthwhile investment, it’s about how quickly you can take your business mobile.

Key Takeaways: Mobile App Development Market Growth and Size 

  • Exponential Growth: The mobile app development market is expected to reach USD 305.18 billion in 2026, growing at a 18% CAGR until 2031.
  • Rising Mobile Usage: Over 75% of the global population is online via mobile, with 7 million smartphones shipped in Q3 2025, fueled by AI-driven devices.
  • 5G Expansion: By 2025, 16% of global mobile connections will be powered by 5G, unlocking faster, more efficient mobile app experiences.
  • Low-Code/No-Code Boom: Low-code platforms are growing at 65% CAGR, enabling faster app development with 40-60% reduced costs.
  • AI and Machine Learning Integration: AI is making apps smarter, enhancing user experiences, and driving 20% increases in developer productivity.
  • Healthcare and E-Commerce Demand: Key sectors like healthcare, retail, and fintech are experiencing the highest growth in mobile app adoption, with telemedicine and mobile commerce
  • Regional Growth: Asia-Pacific leads with the largest market share, while North America continues to dominate with premium users and high ARPU.
  • App Development Costs: Development costs range from $40K to $400K+ depending on app complexity, with healthcare apps needing higher budgets for compliance.

Why Is 2026 The Best Time To Invest In Mobile App Development?

Here’s why 2026 is the ideal time to invest:

  • Rising Mobile Usage: With over 75% of the global population now online via mobile, your customers are already mobile-first. Smartphone shipments grew 6% in Q3 2025, hitting 322.7 million units, fueled by the demand for AI-driven devices. If your business isn’t mobile-first yet, it’s time to catch up.
  • Digital Transformation Is Essential: Businesses that hesitated to go mobile have already felt the consequences, with competitors taking the lead. Companies are now allocating 15% of IT budgets to mobile projects, modernizing systems and improving customer experiences. This isn’t a trend, it’s a necessity.
  • 5G Unlocks New Possibilities: The rollout of 5G technology is set to revolutionize app capabilities with ultra-low-latency and seamless connectivity. In 2025, over 16% of global mobile connections were reported to be powered by 5G (Sensor Tower), opening up new avenues for real-time features and enhanced user experiences.

If you’re still on the fence about mobile apps, it’s time to move quickly. The mobile-first future is already here, how fast can you scale?

What is the Mobile App Development Market Size and Growth Projections?

The mobile app development market is on a steep growth trajectory, with the market size expected to reach USD 305.18 billion in 2026 and grow to USD 618.65 billion by 2031. This represents a CAGR of 15.18% from 2026 to 2031, highlighting an undeniable trend: the market is not just growing, it’s accelerating.

Let’s break down the key numbers and trends that are shaping the future of this industry.

Metric Value
2026 Market Size USD 305.18 billion
2031 Projected Market Size USD 618.65 billion
CAGR (2026-2031) 15.18%

These numbers highlight an undeniable trend: the mobile app development market is not just growing, it’s accelerating. I’m seeing this firsthand working with both big companies and startups. So, what’s driving this?

  • Low-code/no-code platforms are skyrocketing, growing at a 65% CAGR. These platforms let businesses build apps without huge dev teams, speeding up time-to-market from months to weeks.
  • AI integration is boosting efficiency. Tools like GitHub Copilot are increasing developer productivity by 20%. Plus, IBM’s AI-driven services are making billions, clearly, the big players are investing in AI-heavy app development.
  • Mobile apps are becoming serious revenue drivers. The mobile app market is set to grow from USD 330.02 billion in 2026 to over USD 1 trillion by 2034, a 1% CAGR.

To put it simply: Invest $1 million in app development today, and you could see a return of 200-400% within 18-24 months, depending on execution.

While the numbers vary slightly based on methodology, they all agree, this market is booming. And early movers are reaping the biggest rewards.

Key Trends in Mobile App Development for 2026 and Beyond

The mobile app development landscape is evolving fast, and the trends shaping 2026 will set apart the businesses leading the charge.

Here’s a quick rundown of the key trends you should be watching:

AI and Machine Learning Integration

AI is now the backbone of mobile apps, not just a “nice-to-have.” From personalized experiences to predictive analytics, AI is making apps smarter and more efficient.

AI is becoming a core part of product development in consumer electronics, not just a feature. It’s speeding up hardware design, enabling virtual prototyping, shifting to edge AI for better security, and enhancing supply chain resilience, emphasizes Theodore (Theo) Aggelopoulos, Senior ICT Product & Programme Manager. 

Low-Code and No-Code Development Platforms

These platforms are growing at 26.7% CAGR, democratizing app creation. They reduce development costs by 40-60% and speed up time-to-market. One healthcare provider built a patient management app in just 6 weeks, a project that would have taken months using traditional development.

5G Technology Enablement

5G is more than just faster speeds, it’s enabling real-time AR/VR, seamless IoT connectivity, and edge computing. By 2026, 5G is expected to cover over 60% of global mobile connections, opening up new possibilities for mobile app features.

Progressive Web Apps (PWAs)

PWAs are bridging the gap between web and mobile apps. They’re cost-effective, offline-enabled, and don’t require app store submissions. I’ve seen businesses cut development costs by 60% using PWAs, while gaining the benefits of both web and native apps.

Cross-Platform Development Frameworks

Tools like Flutter and React Native are now mature enough to be my go-to for 70% of projects. With a single codebase for both iOS and Android, businesses save 50-60% in development time while achieving performance close to native apps.

Augmented Reality (AR) and Virtual Reality (VR)

The AR/VR market is booming and set to hit $451.5 billion by 2030. I’ve implemented AR solutions for retail (boosting conversion rates by 35%) and real estate (reducing unnecessary site visits by 60%).

Internet of Things (IoT) Integration

IoT is transforming mobile apps into control centers for smart homes, healthcare, and manufacturing. I’ve helped companies create apps that enable everything from remote patient monitoring to predictive maintenance in factories.

Enhanced Security and Privacy Features

As regulations like GDPR and CCPA tighten, security is crucial. We’re seeing more biometric authentication, end-to-end encryption, and privacy-by-design features. In fact, Apple’s App Tracking Transparency has already rejected 12% of apps for non-compliance.

Cloud-Native Development

Cloud implementations now control 57.35% of the market and continue to grow at a 21.8% CAGR. Cloud-native apps offer scalability, low-latency access, and automated deployment, making them essential for modern app development.

These trends aren’t isolated, they’re interconnected. Companies combining AI, 5G, and IoT are seeing 3-5x better results than those implementing a single technology. If you’re not already incorporating these into your strategy, you’re falling behind.

Key Market Segments Driving Growth in 2026

As mobile app development continues its explosive growth in 2026, several key industry segments are leading the charge. By focusing on these high-potential sectors, businesses can strategically position themselves for success and maximize their return on investment.

Let’s take a quicker look at the segments fueling this growth and the opportunities they present before we dive into the details:

Industry Segment Market Share 2026 Growth Rate (CAGR) Typical Development Cost Key Opportunity
Healthcare Growing Fast 20.08% $100K-$300K Telemedicine, Remote Monitoring
Retail/E-commerce 33.70% 15-18% $60K-$200K Mobile Commerce, AR Experiences
FinTech/Banking Significant 19.2% $120K-$200K+ Digital Banking, Payments
Gaming 39.6% Revenue 12-15% $150K-$500K+ In-App Purchases, Subscriptions
Education Growing Rapidly 21.5% $50K-$150K Adaptive Learning, E-Learning
Transport/Logistics Established 15-17% $80K-$200K On-Demand Services, Delivery

 Healthcare

Healthcare apps are exploding in demand, and the ROI here is impressive. Key drivers include the surge in telemedicine (remote consultations up 600% since 2020) and wearable device integration (over 80% of users now using health apps). AppVerticals has helped healthcare providers like Visionze enhance their patient management security and operations.

FinTech and Banking

Fintech is rapidly growing, with a 19.2% CAGR. Digital banking is now a priority for traditional banks, and mobile wallets, blockchain, and investment platforms are revolutionizing the space.

Gifted Financial Services needed a unified digital platform to replace manual loan workflows, paperwork, and fragmented client records. AppVerticals suggested a cloud-native solution combining digital onboarding, secure document handling, automated underwriting, and integrated payments and delivered the same, ensuring they leverage the technology as much as possible.

Education and E-Learning: Digital Transformation of Learning

Education apps are expected to reach $7.27 billion in 2026, with the market projected to grow 21.5% CAGR. The rise of adaptive learning and gamification is transforming how education is delivered, with engagement increasing by up to 80%.

Budget University needed a mobile LMS that could deliver interactive lessons, cross-subject integration, and real-life financial scenarios. AppVerticals engineered a system tested through 80+ prototypes, 2,500 user-study interactions, and six iterative UX cycles. Our efforts helped them achieve:

  • 47% Improved Lessons Completion Rates
  • Improved Navigation Cut Drop-Off by 41%
  • Increased Weekly Logins by

Transport and Logistics: On-Demand Mobility

Transport and logistics apps are reshaping urban mobility. With real-time tracking, dynamic pricing, and multi-modal integration, ride-sharing and delivery services are booming. Building app like Uber Freight typically cost $80K-$200K to develop but offer significant growth potential in last-mile delivery and e-commerce fulfillment.

Regional Breakdown: Which Markets Are Leading Mobile App Development?

Geographic dynamics play a huge role in app strategy, costs, and market opportunities. Here’s a snapshot of the top markets in mobile app development for 2025 before we dig in the details:

Region Market Size 2026 Growth Rate Development Cost Index Key Advantage Primary Challenge
Asia-Pacific $157.94B 17.9% Low (60-70) Massive scale, growth Fragmentation, localization
North America $78.77B 14.5% High (100) Premium users, ARPU High development costs
Europe $42.36B 13.4% High (90-95) Quality, regulation GDPR complexity
Middle East & Africa $13.45B Highest Medium (70-80) Government support Infrastructure gaps
Latin America $19.81B 15-17% Medium (65-75) Young demographics Economic volatility

 1. Asia-Pacific: The Fastest-Growing Powerhouse

Asia-Pacific is experiencing the most explosive growth, with 52.92% of global market share in 2025. Key drivers include:

  • Massive smartphone adoption (70%+ in urban areas)
  • Mobile-first population skipping desktops
  • Super-app ecosystems like WeChat and Grab
Development Tip: While growth is huge, expect to invest in localization, language support, and region-specific integrations (e.g., payment systems). China and India are key markets, but strategies need to be tailored to local preferences.

2. North America: The Innovation Leader

North America continues to lead with the highest revenue per user (ARPU). Here’s why:

  • Premium users are willing to pay for high-quality apps
  • Quick adoption of new tech like AR and subscriptions
  • Strong IP protection ensures secure investments
Development Tip: While development costs are high ($100-$150/hour), the premium user base justifies the investment. The U.S. and Canada also offer top-tier talent and venture capital support.

3. Europe: Quality and Compliance Leader

Europe brings a high-quality, privacy-conscious user base but presents unique challenges:

  • GDPR and stringent data privacy regulations
  • Multilingual complexity across countries
  • Sector excellence in automotive, fintech, and IoT
Development Tip: Expect a 15-20% premium on development costs for compliance and localization. Europe is ideal for high-quality, regulated industries like fintech and automotive.

4. Middle East & Africa: The Emerging Frontier

MEA is an exciting emerging market with the highest growth rates projected:

  • Digitalization initiatives in Saudi Arabia and UAE
  • Smart city investments and government support
  • Islamic finance and mobile-first banking
Development Tip: Infrastructure gaps exist, so focus on Arabic language support and local payment integrations. However, the region offers early-mover advantages and strong government backing for tech projects.

5. Latin America: The Growing Market

Latin America presents an attractive, rapidly expanding market driven by mobile-savvy consumers:

  • Young demographics (60% under 35)
  • Fintech growth, addressing underbanked populations
  • E-commerce acceleration with mobile commerce growing 35% annually
Development Tip: Be mindful of economic volatility and the need for localization in different countries (Spanish vs. Portuguese). Latin America offers a great opportunity for mobile-first apps but requires careful pricing and infrastructure planning.

Strategic Recommendations

Align your geographic strategy with your business model:

  • Premium B2C apps: Focus on North America and Western Europe.
  • Scale/growth: Target Asia-Pacific, particularly India and Southeast Asia.
  • Enterprise solutions: North America and Europe are ideal for large contracts.
  • Emerging opportunities: Consider MEA and Latin America for early-mover advantages.
  • A phased rollout works best: Start with your strongest market (usually North America), prove your model, then expand into high-growth regions with localized versions.

Costs and Timelines for Mobile App Development in 2026

Understanding the true costs and timelines behind app development is crucial for making informed decisions. Here’s a breakdown that reflects realistic expectations, helping you plan your budget and avoid any unexpected expenses.

Mobile App Development Cost Breakdown by Complexity

The complexity of your app plays a significant role in determining the development cost and timeline. Here’s a quick overview based on common app types:

App Type Cost Range Timeline Typical Features
Basic App (MVP) $40K – $100K 3-6 months User auth, basic UI, simple database, API
Medium Complexity App $100K – $200K 6-9 months Payment integration, social media, moderate backend
Complex Enterprise App $200K – $400K+ 9-18 months AR/AI, real-time sync, high security, multiple platforms

The range of mobile app development cost for each app type reflects its functionality and the level of complexity involved. A Minimum Viable Product (MVP) is a great starting point for testing your idea, while a more complex enterprise app involves additional features like AI, security, and integration with multiple platforms.

App Development Cost by Industry (2026 Benchmarks)

Costs can also vary significantly by industry. Different industries require different functionalities and levels of security, which impact development time and budget.

Below are the typical costs you should expect in 2026 across various sectors:

Industry Cost Range Average Timeline Key Cost Drivers
Healthcare $150K – $300K 9-12 months HIPAA compliance, data security
FinTech $120K – $250K 9-15 months Security, payment processing
E-commerce $80K – $200K 6-9 months Payment integration, logistics
Gaming $150K – $500K+ 12-18 months Graphics, monetization
Education $60K – $150K 6-9 months Content management, video integration
Transportation $100K – $250K 9-12 months Real-time tracking, mapping

Certain industries, such as healthcare and fintech, require a higher budget due to complex regulatory compliance and security requirements. On the other hand, sectors like e-commerce or education typically have lower development costs due to less stringent regulations and simpler feature sets.

Regional Cost Variations

App development costs vary widely depending on where the work is done. The region you choose will impact the overall cost and quality of the product:

Region Developer Rates Cost % vs North America Best for
North America (U.S./Canada) $100-$200/hour 100% Complex projects, IP-sensitive work
Western Europe $75-$150/hour 70-90% High-quality development, GDPR compliance
Eastern Europe $40-$80/hour 40-60% Cost-effective, high-quality work
Asia (India/Philippines) $20-$50/hour 30-50% Maximum cost-efficiency

North America offers the highest quality and fastest communication, but it comes at a premium cost. If you need to optimize your budget, Eastern Europe and Asia provide excellent alternatives, though communication can be more challenging.

Development Phase Timeline Breakdown

A successful mobile app goes through multiple phases, each with its own cost implications. Here’s quick mobile app development guide offering the typical timeline and costs involved in each stage:

Phase Cost % Timeline Activities
Phase 1: Discovery & Planning 5-10% 2-4 weeks Requirements, market research, technical assessment
Phase 2: UI/UX Design 10-15% 3-6 weeks User flows, wireframes, visual design
Phase 3: Development 50-60% 8-16 weeks Front-end, back-end, API, database
Phase 4: Testing & QA 15-20% 2-4 weeks Functional, performance, security testing
Phase 5: Deployment 5-8% 1-2 weeks App store submission, launch monitoring
Phase 6: Post-Launch Support 15-20% Ongoing Bug fixes, updates, performance monitoring

Each phase is integral to the final outcome of your app. Skipping or rushing through phases like Discovery & Planning or Testing can lead to issues later on that could significantly impact both cost and timeline.

Strategic Recommendation:

  • Premium B2C apps: Focus on North America and Western Europe for top-tier quality.
  • Growth-focused apps: Consider Eastern Europe or Asia for cost-effective scaling.
  • Specialized features: Prioritize best-in-class developers regardless of location.

By adopting a hybrid approach, leveraging both high-quality regions for strategy and more cost-effective ones for implementation, you can achieve the best of both worlds, saving up to 30-40% on your project.

AppVerticals suggests: Budget 20% more than initial estimates and 30% more time than projected. I’ve never seen a project come in significantly under budget, but I’ve seen hundreds exceed initial estimates. The successful clients are those who plan for realistic scenarios, not optimistic ones.

The good news? When done right, mobile apps generate 3-5x ROI within 24-36 months through increased revenue, reduced costs, and improved customer engagement. The key is investing wisely in the right features, quality development, and proper architecture from day one.

What Are the Projected Market Trends for Mobile App Development Through 2030?

Mobile app development is evolving rapidly, with trends already shaping the future. Here’s where the industry is heading by 2030, based on current data and emerging innovations.

AI-Powered Applications: The Intelligence Layer

Global AI market is expected to reach $1.8 trillion by 2030, with mobile apps being key contributors.
AI is becoming the backbone of mobile apps, enabling hyper-personalized user experiences and next-level automation. By 2030, AI will be a core feature in nearly every app.

Hyper-Personalization at Scale

  • AI-powered content curation: Apps will predict user preferences better than they know themselves.
  • Real-time experiences: Anticipating user needs before they express them.
  • Dynamic interfaces: UI that adapts to individual user behaviors.

Generative AI Integration

  • Content creation: Apps will generate text, images, and video on-device.
  • Code generation: Self-modifying app functionalities.
  • Voice synthesis: Personalized, AI-driven voice interactions.

On-Device AI Processing

  • Privacy and speed: AI processing happening locally to reduce reliance on servers.
  • Examples: Real-time photo enhancements, voice recognition, and object detection.

Immersive Technologies: AR and VR Going Mainstream

AR/VR market will reach $451.5 billion by 2030. Augmented Reality (AR) and Virtual Reality (VR) are becoming mainstream tools in retail, healthcare, education, and more, evolving from niche technologies to essential business solutions.

Augmented Reality (AR) Applications

  • Retail & E-Commerce: Virtual try-ons and in-store navigation.
  • Real Estate: Virtual property tours and design visualization.
  • Healthcare: 3D surgical planning and immersive medical training.

Virtual Reality (VR) Applications

  • Training: Immersive, risk-free learning environments.
  • Remote Collaboration: Virtual teams working in shared 3D spaces.
  • Mixed Reality (MR): Combining AR and VR for hybrid experiences like virtual monitors and collaborative tools.

Internet of Things (IoT) Integration: Connected Ecosystems

Mobile apps will control 75 billion connected devices by 2030.

Smart Home Control

  • Predictive automation: Systems learning and adapting to user behavior.
  • Energy optimization: AI-driven consumption management.

Health and Wellness IoT

  • Wearables: Continuous health monitoring, predictive healthcare alerts.
  • Remote care: Reducing hospital visits and improving patient outcomes.

Industrial IoT Applications

  • Predictive maintenance: Sensors predicting equipment failure.
  • Supply chain tracking: Real-time visibility of materials and products.

5G and Edge Computing: The Infrastructure Revolution

60% of global connections will be 5G by 2025. Here’s why and how:

Real-Time Multiplayer Experiences

  • Cloud gaming and collaborative AR/VR applications with no lag.

Edge Computing

  • Sub-50ms latency: Instant app response times.
  • Privacy and bandwidth efficiency: Localized processing, reducing server dependency.

Privacy-First Design: From Compliance to Competitive Advantage

Regulatory Landscape: GDPR, CCPA, PIPL, and other global privacy regulations.

Zero-Knowledge Architecture: End-to-end encryption and decentralized storage to protect user data.

Privacy-Enhancing Technologies: Differential privacy, federated learning, and homomorphic encryption to enhance data security without compromising functionality.

Super Apps: The All-in-One Platform

Super apps are exploding in popularity, especially in Asia-Pacific.

For Example,

  • WeChat: Social networking, payments, e-commerce, and more.
  • Grab: Ride-hailing, payments, insurance, and deliveries.

Subscription-Based Monetization: Recurring Revenue Models

Subscription apps are growing at 17.4% CAGR.

  • Free tier: Attract users.
  • Premium tier: Unlock advanced features for $9.99/month.
  • Hybrid Monetization Models: Helps with In-app purchases, subscriptions, and ads for diversified revenue.

No-Code/Low-Code Democratization

No-code platforms are projected to grow from $28.11 billion in 2024 to $35.61 billion in 2026.

For Businesses

  • Faster development: Reduce time from months to weeks.
  • Lower costs: 40-60% less than traditional development.

For Developers

  • Specialization: Focus on complex apps, leaving routine apps to no-code tools.

Sustainability and Green Computing

Environmental impact will become a key factor in app development.

  • Optimized code: Reducing CPU usage and battery drain.
  • Dark modes: Energy savings on OLED screens.
  • Edge processing: Reducing data center load, improving energy efficiency.

2030 Market Projection Summary

Trend Market Size 2030 Current Adoption Investment Priority ROI Timeline
AI Integration $1.8T 35% of apps High (Critical) 6-12 months
AR/VR $451.5B 15% of apps Medium (Growing) 18-24 months
IoT Connectivity 75B devices 40% integration High (Expanding) 12-24 months
5G Optimization 60%+ coverage 20% optimized Medium (Prepare) 24-36 months
Privacy-First Mandatory 60% compliant High (Required) 6-12 months
Subscription Models Dominant 45% of revenue High (Proven) 3-6 months

The apps that will dominate by 2030 will seamlessly integrate AI, respect user privacy, provide immersive experiences, and offer continuous value to users.

Conclusion: Your Mobile App Investment Decision

After walking you through market size, trends, opportunities, and practical considerations, let me be direct: The mobile app development market isn’t just growing, it’s becoming the primary interface between businesses and customers across every industry.

With the market projected to grow from $305.18 billion in 2026 to $618.65 billion by 2031 at a 15.18% CAGR, the question isn’t whether to invest in mobile, it’s how quickly you can execute a strategy that positions your business for this mobile-first future.

AppVerticals has helped hundreds of executives navigate mobile app investments. The ones who succeed aren’t necessarily the ones with the biggest budgets or most innovative ideas. They’re the ones who execute methodically, stay focused on business outcomes, and adapt based on real-world results.

The mobile app development market is $305 billion and growing 15% annually because mobile apps generate real business value when done right. Your competitors are investing. Your customers expect mobile experiences. The technology is mature and accessible.

The only question left: When will you start?

AppVerticals recommend: Now. The best time to invest was five years ago. The second-best time is today. Every month you delay is a month of opportunity lost to competitors who are already building.

Ready to move forward?

Start with that MVP. Define those 3-5 core features. Launch in 6 months. Iterate based on data. Scale what works.


More Related Guides:

How Much Does Telemedicine App Development Cost? 2026 Guide for Healthcare Leaders

In 2026, the cost of developing a telemedicine app typically ranges between $110,000 and $230,000 for a compliant MVP (Minimum Viable Product). For enterprise-level platforms that include advanced features such as electronic health records (EHR), compliance features, and multi-state workflows, the cost can range from $450,000 to over $1,000,000, depending on the complexity and scope of the app.

Telemedicine has evolved from a digital channel to a core care modality, but the budgeting process remains complex.

If you’re unsure of why the prices majorly vary, this guide provides a comprehensive breakdown of telemedicine app development costs, key cost drivers, hidden expenses, and strategies to optimize ROI, ensuring you don’t overlook critical elements like compliance or scalability.

Key Takeaways: Telemedicine App Development Cost

  • Cost Ranges: Telemedicine app development typically costs $110k–$230k for a compliant MVP and can range from $450k–$1M+ for enterprise-level platforms, depending on features, integrations, and compliance requirements.
  • Key Cost Drivers: The biggest cost drivers include video integration, security and compliance (HIPAA), EHR/FHIR integration, and the platform choice (native vs. cross-platform).
  • Ongoing Costs: Expect annual maintenance costs to be 15–20% of the initial development cost, covering updates, security patches, OS changes, and compliance adjustments.
  • Video Functionality: Video is usually the most expensive part of telemedicine apps. For instance, Twilio charges $0.004 per participant per minute, and costs can quickly rise at scale.
  • Hidden Costs: Don’t overlook costs for security automation, cloud hosting, and regulatory compliance. Failing to properly budget for these can lead to expensive fixes and potential data breaches.
  • Optimization Tips: Focus on essential features for your MVP, leverage cross-platform tools to save on development costs, and consider outsourcing non-critical tasks to more cost-effective regions without compromising compliance.

What is the Average Cost of Telemedicine App Development?

Telemedicine app development costs vary significantly depending on the scope, features, and compliance requirements. These costs are influenced by several key factors, including the level of integration, regulatory compliance (such as HIPAA), and advanced features like EHR or telemedicine protocols.

Whether you’re looking to create a basic app for a single practice or considering full-fledged healthcare app development solutions to cater to you telemedicine needs, here’s a breakdown of the typical costs and timelines for each stage of development in 2026.

Tier What You’re Building Typical Budget Typical Timeline
MVP Single specialty app with scheduling, video calls, basic messaging, and admin $110k–$230k+ 3–5 months
Growth Product Adds EHR/FHIR integration, e-prescriptions, advanced admin features, payment flows $230k–$450k 6–10 months
Enterprise Platform Multi-org platform with SSO, complex roles, state/provider operations, compliance automation $450k–$1M+ 9–18+ months

It’s important to understand that when dealing with patient health information (PHI), the “cheap telemedicine app” is often a myth. One of the biggest budgeting mistakes is underestimating compliance costs.

Although it’s tempting to minimize security and regulatory requirements in the MVP phase, doing so can result in costly rework and potential legal risks. Ensure that HIPAA compliance and secure data handling are prioritized from the start to avoid expensive fixes later on.

Real-Time Budget Breakdown for Telemedicine App Development (2026)

When developing a telemedicine app, it’s essential to understand how your budget will be allocated across different stages of development.

Below is a real-time breakdown of the typical costs for creating a telemedicine MVP, Growth Product, and Enterprise Platform, with an additional focus on what could drive your costs up quickly.

Category Cost Estimate Description
Discovery & Compliance $15k – $30k Market research, legal consultations for HIPAA compliance, initial system planning, and project scoping.
UI/UX Design & Prototyping $12k – $25k Tailored design for both patient and clinician experiences, including user flows and initial prototyping.
Backend Development $30k – $55k Core functionality such as video conferencing integration, appointment scheduling, secure messaging, and data storage.
Frontend Development $25k – $45k Development of the mobile patient app (iOS/Android) and the clinician/admin web portal.
Video Infrastructure & Integration $10k – $25k Setup and integration of video conferencing tools (Twilio, Agora, etc.).
Security & Compliance Workstream $20k – $50k HIPAA compliance work, encryption, access control, audit logs, and secure data handling protocols.

Total Estimate for MVP: $110k – $230k+

What Adds $50k–$150k Fast in Telemedicine App Development

Certain features, tools, or compliance factors can quickly escalate the development cost. Here’s a breakdown of areas that typically add between $50k–$150k:

  1. EHR Integration (FHIR/HL7)
    • Estimated Cost: $50k–$100k
      Integrating with Electronic Health Records (EHR) systems requires compliance with healthcare standards and ensures data is correctly shared between systems, which adds complexity and cost.
  2. HD Video Calls & Multi-Party Video Features
    • Estimated Cost: $25k–$50k
      Higher-quality video and features like multi-party consultations, recordings, and scheduling integrations add substantial cost due to technical complexity and scalability requirements.
  3. Payment Integration & Insurance Reimbursement
    • Estimated Cost: $30k–$75k
      Integrating payment systems for patient transactions, as well as supporting insurance verification and claims, increases complexity, especially with the need for secure, compliant payment processing.
  4. Advanced Reporting & Analytics
    • Estimated Cost: $25k–$50k
      If your app requires sophisticated reporting and business intelligence (e.g., tracking patient data, provider performance), this will add substantial development costs.
  5. Regulatory Compliance Workstream
    • Estimated Cost: $25k–$60k
      Meeting regulatory requirements such as HIPAA, the FDA (for medical devices), or multi-state telemedicine licenses can quickly add costs, especially when scalability or cross-border support is needed.

What You Can Defer Safely in Version 1 (V1)

For your MVP, focusing on core functionalities is key to keeping costs manageable. Here are some elements that can be safely deferred until later versions:

  1. Multi-Language Support
    Postpone adding multiple languages for global reach until you have validated your app and are expanding to new regions.
  2. Advanced AI Features for Diagnosis or Triage
    AI-powered diagnosis or predictive analytics can be highly valuable but can be complex and costly to implement in the MVP. You can add these later when the platform is more established.
  3. Complex Admin Features
    Features like real-time analytics dashboards, customizable reporting, or in-depth patient-tracking systems can be added in later versions once the app has scaled.
  4. Cross-State Licensing and Multi-State Telemedicine Support
    While essential for expanding your service, supporting telemedicine across multiple states or countries with varying regulations can be deferred until you’ve proven your model in one region.
  5. Integrations with External Systems (Labs, Pharmacies)
    If your app requires integrations with third-party systems like pharmacies or labs, consider deferring them until you’ve established a solid patient-provider core service.

Factors Affecting The Cost Of Telemedicine App Development

Understanding the key factors that influence the cost of telemedicine app development is crucial for budgeting and planning a successful project.

App Platform Choices (Native vs. Cross-Platform)

The platform you choose for your app can greatly affect both the development cost and maintenance over time:

  • Native iOS + Native Android: These options tend to cost more because you’re essentially building and maintaining two separate apps (plus a backend).
  • Cross-platform: This approach can help save costs by sharing code between iOS and Android. It’s a good fit for most telemedicine products, especially patient-facing apps and clinician web portals.
Pricing Insight: According to Clutch, creating two native apps can often “double” the overall cost, even when the hourly rates are similar across operating systems. For most telemedicine apps, a cross-platform patient app and web clinician portal hit the sweet spot in terms of both cost and speed. Native is only recommended if you need heavy device integration or face performance constraints.

Development Approach and Phases (Where the Money Goes)

The budget for telemedicine app development is typically split among several key phases. Here’s a rough breakdown of where the money tends to go:

  • Discovery + compliance planning
  • UX/UI design + prototyping
  • Backend development (identity management, scheduling, video systems, data storage)
  • Frontend development (patient, provider, admin apps)
  • QA, security testing, and release hardening

Backend complexity is often a major cost driver, and ongoing maintenance typically accounts for 15–20% of the initial build cost annually.

Location of the Development Team (Hourly Rate Differences)

Where your development team is based can have a significant impact on the cost. Here’s a snapshot of hourly rates by region for 2026:

Location Hourly Rate Range
United States $100 – $149/hr
India < $25/hr
Ukraine $25 – $49/hr
Poland $50 – $99/hr
Leadership Insight: Offshore savings can be significant, but when developing a regulated healthcare product, the real risk isn’t just the hourly rate. The most expensive outcome is delivering a non-compliant product, which could result in rework, audit failures, and security gaps, especially when deadlines and compliance are crucial.

Size of Your Development Team (Roles That Matter)

The size and composition of your team also play a big role in the cost. A typical telemedicine development team includes:

  • Product Manager (with healthcare domain knowledge)
  • UX/UI Designer (focused on usability for both patients and clinicians)
  • Mobile Engineers (for the patient app)
  • Web Engineers (for the clinician/admin portal)
  • Backend Engineers (handling services, data, integrations)
  • QA Engineers (to ensure quality and test the app)
  • DevOps/SRE (for infrastructure, monitoring, and incident management)
  • Security/Compliance Support (to ensure everything is HIPAA-compliant)

For white-label builds, a typical team should consist of a product manager, backend developers, mobile developers, designer, and QA engineers.

Ongoing Maintenance Costs

Ongoing maintenance is a critical part of any telemedicine app’s lifecycle. Typically, you’ll need to budget around 15–20% of your initial development cost each year for maintenance. This covers things like updates, security patches, operating system changes, infrastructure tuning, and keeping up with compliance requirements.

Tech Stack and Its Impact on Costs

The technology stack you choose will have a significant impact on your development cost. For telemedicine apps, the stack usually includes:

  • Mobile/web frameworks (React Native, Flutter, etc.)
  • Backend services + databases (servers, cloud services, storage)
  • Video infrastructure (for video calls and consultations)
  • Identity management (like MFA, SSO for security)
  • Logging, auditing, and monitoring (to ensure everything is running smoothly)
  • Integration layers (such as FHIR/HL7 for medical records, payment gateways, e-prescription systems)

Interoperability, or how your app communicates with other systems, often relies on FHIR standards (Fast Healthcare Interoperability Resources). The healthcare industry is increasingly moving towards API-based exchanges, driven by regulatory push for easier data sharing.

Ensure Your Telemedicine App is Fully HIPAA-Compliant

Don’t take shortcuts when it comes to healthcare data security. Our team can help you integrate HIPAA compliance seamlessly into your app, protecting patient data while ensuring legal adherence.

Hidden Costs in Telemedicine App Development

Building a telemedicine app doesn’t end with the initial development. There are hidden costs that you’ll need to account for, especially once the app is live and being used.

Let’s break down some of these ongoing costs.

Ongoing Maintenance and Upgrades (The “Forever” Budget)

Maintenance isn’t just about fixing bugs; it includes ongoing updates to keep the app running smoothly. Some of the key ongoing maintenance costs are:

  • Operating system (OS) upgrades (iOS/Android changes)
  • Vendor SDK upgrades (such as for video, analytics, or communication tools)
  • Security patches to keep your app safe
  • Compliance updates (like audit logs and access controls)
  • Performance and reliability improvements to ensure the app runs well over time

These upgrades and improvements are essential to keeping the app secure and functional, but they also represent a significant ongoing budget.

Cloud Hosting and Infrastructure Costs (Video Changes Everything)

Video functionality is usually the biggest ongoing cost for telemedicine apps. Here’s how video APIs typically charge for usage:

Service Cost
Twilio Video $0.004 per participant per minute
Amazon Chime SDK (WebRTC) $0.0017 per attendee-minute (plus extra features like capture/recording)
Vonage Video API $0.00395 per participant per minute
Agora (Video HD) $3.99 per 1,000 participant minutes (plus tiers/analytics packages)

If you have a 20-minute video call with 2 participants, that’s 40 participant-minutes. On Twilio, this would cost $0.16 for video transport alone, before factoring in other costs like recording, transcription, and storage. At scale, say 100k visits per month that cost can quickly add up.

Marketing, Branding, and User Acquisition

A major reason why telemedicine apps fail isn’t that the video feature didn’t work, it’s because:

  • Providers didn’t adopt the necessary workflows
  • Patient onboarding was too complicated or confusing
  • Retention wasn’t properly managed (such as through reminders, rescheduling, or refills)

To avoid these pitfalls, make sure to budget for onboarding content, training for providers, and ongoing engagement strategies, especially for apps that need to support multiple sites or locations.

Regulatory Compliance and Licensing Fees

Healthcare apps need to meet strict regulations, and staying compliant can be costly. Here are some key compliance costs to watch for:

  • HIPAA & Cloud BAAs: Healthcare apps must comply with HIPAA standards to protect patient information. Cloud providers handling sensitive data are considered “business associates,” and you’ll need a Business Associate Agreement (BAA) with them. Even encrypted storage requires BAAs.
  • Cloud Provider Compliance: Major cloud providers like Google, Microsoft, and AWS offer HIPAA-compliant services but with shared responsibility. Make sure your agreements and services are fully compliant.
  • FDA Considerations: If your app functions like medical software or a device, you may need to consider FDA regulations. The FDA provides clear guidelines on when software needs to be classified as a medical device.
  • State Licensing: For telemedicine across multiple states, licensing can be expensive. The Interstate Medical Licensure Compact charges an initial $700 fee plus state licensing fees.

The Cost of Getting Security Wrong (Why “Hidden” Costs Matter)

Security isn’t something you can overlook, it’s essential for telemedicine apps, especially when dealing with sensitive patient data. Here’s why getting security wrong can be so costly:

  • Healthcare’s average breach cost: $9.77M, still the highest of any industry
  • Global average breach cost: $4.88M
  • S. average breach cost: $9.36M
  • AI and automation savings: Using security AI/automation can reduce breach costs by $1.88M, and up to $2.2M when used extensively in prevention.
  • Cloud vs. On-prem: Breaches in the public cloud are more costly at $5.17M compared to $4.31M for on-prem solutions.

When it comes to healthcare app development cost, be it a telemedicine app or another, the hidden expenses can quickly escalate if not planned for, so it’s important to keep them in mind as you budget. Maintaining security, compliance, and ongoing system reliability are non-negotiable, and crucial for long-term success.

Developing an MVP: The Smart Way to Reduce Telemedicine App Development Costs

When developing a telemedicine app, an MVP (Minimum Viable Product) isn’t just about launching a basic app, it’s about testing and validating whether your clinical workflows and reimbursement models will work in the real world.

The goal of the MVP should be to prove the essential elements of your telemedicine app before committing to full development.

A typical MVP for telemedicine will include the following core functionalities:

  • Patient onboarding & identity management (including multi-factor authentication (MFA) for security)
  • Provider onboarding & scheduling to ensure seamless interactions
  • Video visits (with fallback to audio-only when needed)
  • Secure messaging (limited to essential communication)
  • Minimal documentation & visit notes export (doesn’t require full EHR writeback yet)
  • Admin tools (role management, basic reporting, audit logs)

Cost Estimate: Based on experience, the cost of building a telemedicine MVP typically ranges from $110k to $230k+, depending on the depth of features and compliance requirements. Also, the cost of building an app by country can vary significantly based on developer rates, market conditions, and regional compliance factors.

Bold MVP Insight: If your MVP doesn’t include key features like audit logging, access controls, and secure data handling, it’s not really an MVP, it’s a prototype. In healthcare, prototypes can easily slip into production by accident, which is where the risks, especially around security and compliance, start to spiral.

Other Ways to Optimize the Cost of Developing a Telemedicine App

When developing a telemedicine app, there are several ways to keep costs down without sacrificing quality. Here are some practical strategies to optimize development costs:

Focus on Essential Features

One way to reduce the scope of your app and keep costs manageable is by cutting out non-essential features. Here’s what you can remove from the MVP scope:

  • “Nice-to-have” personalization (fancy customization features)
  • Non-essential social features (such as chat rooms or social media integrations)
  • Custom video stacks (use a proven video API instead)
  • Deep EHR writeback (start with read-only access and export instead)

However, there are some things you should never cut:

  • Identity, security, and audit trails (these are non-negotiable for healthcare)
  • Uptime and monitoring basics (your app needs to be reliable)
  • Clinician workflow usability (ensure the app is easy for healthcare providers to use)

Leverage Cross-Platform Development

Using cross-platform development tools can save you both time and money, especially for apps that don’t require complex, device-specific features. Here’s how you can use cross-platform development strategically:

  • Patient app: Cross-platform frameworks work well for building a unified app for both iOS and Android users.
  • Lightweight provider companion app: If your provider app doesn’t require heavy device integration, a cross-platform approach can help.

For clinician/admin workflows, consider using a web-based platform instead. Web apps allow you to prioritize release velocity (faster iterations) and screen real estate (especially for complex workflows).

Outsource to Cost-Effective Regions (Without Compromising Compliance)

Outsourcing certain parts of development to cost-effective regions can save money without compromising quality or compliance. Here’s how to make outsourcing work:

  • Keep security architecture, compliance, and integration leadership close to the decision-makers. The key parts of your app that handle sensitive data need to be well-managed and overseen by experienced professionals.
  • Offshore well-defined modules with strong QA (Quality Assurance) gates to ensure that quality isn’t compromised during the development process.
  • Make sure to use Clutch rate benchmarks to check if regional pricing makes sense. For example, you can compare costs for development teams in different countries, ensuring you’re getting the best value without cutting corners on critical features like compliance and security.

These strategies can help you reduce costs while still building a high-quality, compliant telemedicine app. By focusing on essential features, leveraging cross-platform tools, and using outsourcing strategically, you can build an effective telemedicine solution without breaking the bank.

Ready to Build Your Telemedicine App?

Let’s help you plan a cost-effective solution tailored to your business needs.

How to Develop a Cost-Effective Telemedicine App: A Quick Guide

Building a telemedicine app can be expensive, but with the right strategy, you can keep costs under control without sacrificing essential features.

Here’s your telemedicine app development guide, offering a quick approach towards building cost-effective solutions:

cost-effective telemedicine app development

1) Start with a Clear, Focused MVP

  • Define the core features that address the primary needs of your users (e.g., patient scheduling, video calls, secure messaging).
  • Keep your specialty and care model For example, start with urgent care or behavioral health instead of trying to cover everything.
  • Avoid adding unnecessary features that aren’t essential for the MVP (e.g., personalized user dashboards or complex analytics).

Starting with a Minimum Viable Product (MVP) helps you launch faster and reduces initial development time and costs. By focusing on essential features, you avoid overspending on non-critical components.

2) Leverage Cross-Platform Development

  • Use frameworks like React Native or Flutter to build an app that works on both iOS and Android with a single codebase.
  • Focus on a web-based clinician portal to keep costs low, while ensuring fast release cycles.

Cross-platform development allows you to target both iOS and Android users without doubling the cost for two separate apps. It also reduces long-term maintenance costs because you only need to update one codebase.

3) Prioritize Security and Compliance from the Start

  • Plan for HIPAA compliance early on (e.g., encryption, secure authentication) to avoid costly changes later.
  • Use existing security frameworks and trusted third-party APIs to reduce the need for custom-built solutions.
  • Consider using cloud providers that offer built-in compliance features (e.g., AWS, Google Cloud, Microsoft Azure).

By integrating compliance and security features from the beginning, you avoid the costly risk of needing to retrofit these components later. Many cloud providers offer security tools that simplify the process, saving you time and money.

4) Use Proven, Cost-Effective Video APIs

  • Choose established video API providers like Twilio, Agora, or Vonage for video functionality, rather than building a custom solution from scratch.
  • Use pay-per-use pricing models to keep costs predictable as your app scales.

Developing a custom video infrastructure is expensive and time-consuming. By leveraging existing, reliable APIs, you can cut down on development time and ensure a high-quality video experience without the overhead of building it yourself.

5) Outsource Smartly, but Keep Core Functions In-House

  • Outsource non-core tasks (e.g., certain features or modules) to cost-effective regions like Eastern Europe or India.
  • Keep critical functions like security, compliance, and key integrations close to decision-makers to ensure quality and compliance.
  • Use freelancers for specific tasks, such as UI/UX design or QA testing, instead of hiring full-time staff.

Outsourcing tasks to regions with lower hourly rates can significantly reduce development costs. However, maintaining oversight of core functions ensures that the app remains secure, compliant, and of high quality.

6) Focus on User-Centered Design to Improve Retention

  • Design the user interface with simplicity in mind. Avoid overcomplicating the app with features that aren’t essential for the user experience.
  • Iterate quickly based on user feedback to improve usability without spending a lot on upfront design.
  • Provide low-friction onboarding to ensure patients and providers can start using the app without long learning curves.

By designing a user-friendly app and focusing on ease of use, you increase user adoption and retention, reducing the need for costly customer support or rework due to bad user experiences. An intuitive app can also decrease the time spent on training providers and onboarding new users.

7) Use a Modular Approach for Feature Expansion

  • Start with basic features and only add more complex ones (e.g., AI-driven diagnostics or EHR integrations) after your app gains traction.
  • Develop features as modules so that you can add or remove them easily without affecting the entire system.

Building your app in phases allows you to launch sooner and spread out costs over time. Instead of building a full-featured app right away, you can focus on validating your core product and adding features based on user feedback.

8) Plan for Long-Term Maintenance

  • Set aside a budget for ongoing maintenance, including bug fixes, security patches, and compliance updates.
  • Use automated testing and CI/CD (Continuous Integration/Continuous Delivery) tools to streamline updates and reduce the cost of future changes.
  • Plan for cloud infrastructure costs that scale with usage to avoid overspending as your app grows.

Ongoing maintenance is inevitable, but planning for it early can help you avoid unplanned expenses. Automating testing and deployment processes helps keep costs low and improves the speed of future updates.

By focusing on the essentials, leveraging cross-platform tools, and outsourcing smartly, you can build a telemedicine app that’s both high-quality and cost-effective.

Maximize ROI on Your Telemedicine App

Learn how to optimize your app development costs and ensure compliance from day one.

Advanced Capabilities That Elevate Telemedicine App Performance (and ROI)

To take your telemedicine app to the next level, it’s important to include advanced features in alignment with the latest healthcare software development trends. It can not only improve performance but also deliver a strong return on investment (ROI).

Here are a few capabilities that can make a big difference:

AI & Automation for Security and Operations

Integrating AI and automation for security can provide significant cost savings. According to a report from IBM, organizations using AI for security had an average breach cost of $3.84 million, compared to $5.72 million for those that didn’t use AI, saving $1.88 million on average.

Why it’s valuable: Automating security tasks helps reduce the risk of data breaches and cuts down on costly manual monitoring, making your telemedicine app both more secure and cost-efficient.

EHR Integration via FHIR

Integrating your app with EHR (Electronic Health Records) through FHIR (Fast Healthcare Interoperability Resources) standards can improve the workflow for clinicians. It helps them access patient information quickly while reducing the need for duplicate documentation.

Why it’s valuable: FHIR integration improves clinician adoption, reduces errors, and makes your app more efficient, leading to better patient care and a smoother user experience for healthcare providers.

Recording, Transcription, and Auditability

Features like recording, transcription, and audit logs are key for compliance and clinical quality. These features can help you meet regulations and track patient-provider interactions.

Why it’s valuable: These capabilities are essential for maintaining a high standard of care and protecting against legal issues. However, they do come with added costs, such as fees for transcription services or recording APIs (e.g., Twilio).

How to Monetize Your Telemedicine App

Turning your telemedicine app into a profitable business is key. Here are a few ways to monetize your app effectively:

Fee-Based Models

One of the most straightforward monetization options is charging per visit. This can either be a consumer-pay model (where patients pay out of pocket) or a payer contract (where insurance providers cover the cost).

What to consider: When using this model, you’ll need to account for the cost of video minutes, provider time, support, and payment processing. This model works well if you’re targeting high-volume, single-use consultations.

Subscription Models

Another option is to charge a per-member-per-month fee for employers or health plans offering telehealth services to their members. This provides more stable, recurring revenue.

What to consider: While this model helps smooth revenue, it requires strong retention and active utilization to be successful. Ensuring that users regularly engage with your app is key to keeping them subscribed long-term.

Advertisements

While not common for clinical telemedicine apps (due to trust and compliance concerns), ads can sometimes be used for wellness apps or adjacent health services. This can be an additional revenue stream if your app includes non-clinical features like wellness tracking or lifestyle coaching.

What to consider: Be mindful of how ads may affect the user experience and overall trust in your app. Clinical apps need to maintain a high level of professionalism and privacy, so ads should only be used carefully and strategically.

Actionable Recommendations (for healthcare leadership)

If you’re ready to invest in a telemedicine app, here’s the list of suggestions you must consider:

  • Budget for Both “Build” and “Operate” Costs
    When planning your telemedicine app’s budget, separate costs into two categories: the initial build cost and ongoing operate costs. Key areas like video, security, and compliance require recurring payments, so it’s essential to factor in these costs from the start. For example, use real vendor rates (like Twilio, AWS, Vonage, and Agora) to estimate per-visit expenses early on.
  • Treat HIPAA Compliance as Core Architecture
    HIPAA compliance isn’t just a box to tick; it’s a critical part of your app’s architecture. The HHS (Health and Human Services) states that cloud service providers storing or processing electronic protected health information (ePHI) are considered business associates, which means they must sign Business Associate Agreements (BAAs). Shared responsibility for compliance is non-negotiable, so make sure it’s built into your app’s infrastructure from day one.
  • Design for Reimbursement Uncertainty
    The telemedicine reimbursement landscape is constantly evolving, so design your app to be flexible. Medicare’s temporary telehealth flexibilities are extended until January 30, 2026, but long-term policy shifts are still uncertain. Make sure your app includes auditability and solid documentation features so it can adapt to any changes in reimbursement policies.
  • Don’t Underestimate the Importance of Security Automation
    Healthcare data breaches are expensive, averaging $9.77M per incident. Investing in AI and security automation can dramatically lower these costs. AI-powered security tools not only help detect threats faster but can also reduce the overall cost of breaches by up to $1.88M, according to IBM. Prioritize security automation early to protect your app and users.

How AppVerticals Can Help You Develop a Cost-Effective Telemedicine App

At AppVerticals, we specialize in developing secure, scalable, and cost-effective telemedicine apps that meet both healthcare regulations and user needs. Whether you’re building an MVP, expanding features, or navigating compliance challenges, we bring deep expertise in telemedicine solutions, ensuring your app is both efficient and compliant from the start.

With our expert developers as your partner, you’ll receive strategic guidance on everything from cost optimization and cross-platform development to security and compliance. We are committed to helping you build a high-quality telemedicine app that delivers value to both healthcare providers and patients, while keeping costs manageable and scaling as needed for future growth.

Build a Telemedicine App that Grows with You

We’ll help you design a flexible, secure, and adaptable platform that supports growth and keeps you ahead of the competition.

Odoo Implementation Cost: Complete 2026 Pricing Guide & TCO Breakdown

In 2026, Odoo implementation typically costs $15,000–$40,000 for small businesses, $50,000–$100,000 for mid-market companies, and $120,000–$250,000+ for enterprise or multi-entity organizations, depending on scope, customization, integrations, and execution duration.

That range exists because Odoo implementation isn’t a software purchase; it’s an operational transformation project. Data migration, process re-engineering, internal resource allocation, and organizational change routinely cost more than the software licenses themselves. Most finance teams only realize this after they begin working with a certified Odoo development company.

Industry data reinforces this reality. According to Panorama Consulting Group’s 2023 ERP Report, the median ERP implementation cost is $625,000, and only slightly more than half of organizations stayed within their original budget—most often because internal staffing needs and execution effort were underestimated.

That’s the right lens for evaluating Odoo implementation cost as well. Licensing is rarely the budget problem. Execution is. In practice, most Odoo projects are scoped around time and delivery resources, typically ranging from $8,000–$12,000 per month per implementation resource, depending on customization depth and integration complexity.

This guide breaks down where capital actually gets deployed, why vendor quotes can vary by 300%+, and which cost categories most often blindside finance teams during rollout.


TL;DR: Odoo Implementation Cost (2026)

This guide shows that Odoo implementation cost is driven far more by execution than by software licenses.

  • Odoo implementation cost by company size: $15K–$40K (small business), $50K–$100K (mid-market), $120K–$250K+ (enterprise or multi-entity).
  • What drives Odoo implementation cost the most: Odoo data migration cost, Odoo customization cost, Odoo integration cost, user training, and internal project time.
  • Odoo implementation cost per module: Core modules (Accounting, CRM, Sales) fit into the $15K–$40K baseline. Advanced modules (MRP, PLM, Quality, multi-warehouse) typically push projects into $80K–$150K+.
  • Odoo data migration cost: $5K–$15K for clean data vs $30K–$70K for messy, multi-system financial and inventory history.
  • Odoo integration cost (Shopify, WMS, EDI, Salesforce): $8K–$25K per integration, plus 10–15% per year for API maintenance and break/fix.
  • Odoo customization cost: $2K–$8K for light Studio/config changes; $15K–$50K+ for custom Python modules that alter core logic.
  • Odoo support cost after go-live: $12K–$30K per year for bug fixes, enhancements, and user support.
  • Odoo hosting cost: $3.6K–$9.6K per year on Odoo.sh or cloud hosting, depending on volume and environments.
  • Odoo implementation contingency: Finance teams should budget 25–30% contingency for data cleanup, scope changes, and UAT discoveries.

Note: These ranges reflect implementation effort and complexity. Odoo implementations are not priced per user but based on modules, customization, integrations, and delivery duration. Final pricing is confirmed after discovery, once scope, customization depth, and delivery duration are validated.

Get Your Odoo Implementation Cost Scoped by Experts

Work with an Odoo development company that models real costs across data migration, integrations, customization, and long-term support, not just licenses.

Talk to Odoo Specialists

How Much Does Odoo Implementation Really Cost? (2026 Estimates)

The cost of Odoo implementation in 2026 ranges from $15,000 for straightforward deployments to over $200,000 for complex multi-entity enterprise rollouts.

But these numbers obscure the real financial decision: you’re not buying software, you’re funding a capital project that restructures your chart of accounts, inventory logic, procurement workflows, and reporting architecture.

Here’s what drives the range:

  • Scope complexity: A company implementing only Accounting and CRM will spend $15,000–$40,000. Add Manufacturing, PLM, and custom integrations, and you’re at $80,000–$150,000+ because you’re essentially building a digital twin of your operations.
  • Data cleanliness: If your legacy system has duplicate customers, inconsistent SKUs, or unreconciled inventory, expect to allocate $15,000–$40,000 just for data remediation before migration. One mid-market manufacturer we worked with spent 6 weeks reconciling 15 years of BOMs before a single line of Odoo configuration began.
  • Internal capacity: Companies that assign a full-time internal project lead and dedicate SMEs from each department spend 30–40% less than those expecting the implementation partner to “figure it out.” Implementation partners bill $80–$200/hour, whether you provide clear requirements or not.
  • Integration density: Each third-party integration (Salesforce, Shopify, WMS, EDI) adds $8,000–$25,000, depending on API maturity and data volume. Legacy systems without APIs can double integration costs.
  • Organizational readiness: Companies with documented processes and change management discipline achieve go-live faster. McKinsey research consistently shows that most digital transformation programs fail to achieve their stated objectives, largely due to planning gaps and organizational resistance.

Quick Cost Overview by Business Size

Here’s a directional range by company size (implementation + rollout services, not just licenses):

Company Profile Users Modules Year-1 Total Primary Cost Drivers
Small Business 5–20* 3–5 (Accounting, CRM, Inventory) $15,000–$40,000 Configuration, basic training, minimal customization
Mid-Market 20–75* 6–10 (Sales, Purchase, Manufacturing) $50,000–$100,000 Data migration, integrations, process redesign
Enterprise 100+* 10+ (Multi-company, MRP, PLM, custom modules) $120,000–$250,000+ Custom development, multi-site rollout, change management, integrations

Critical insight: The Odoo implementation cost small business category ($15K–$40K) assumes the business has clean data, simple processes, and accepts out-of-the-box functionality. The moment you say “we need custom reports” or “our billing is unique,” costs escalate rapidly because you’re now funding software development, not software deployment.

*User counts are used here as a proxy for business complexity and scope. AppVerticals does not price Odoo implementation on a per-user basis; projects are scoped and quoted based on modules, integrations, data, customization effort, and delivery duration.

How much does Odoo implementation cost per module?

Odoo implementation process cost per module isn’t linear, because modules share data, workflows, and configuration dependencies. As a planning range, core modules (Accounting, CRM, Sales, Purchase) are usually part of a $15K–$40K baseline for small deployments.

Specialized modules like MRP/Manufacturing, PLM, Quality, and multi-warehouse typically push projects into $80K–$150K+ because they require deeper process design, testing, and often integrations.

The safest way to model “per module” is: each additional operational module increases scope, data rules, training, and UAT load, not just configuration hours.

The $15K to $200K+ Reality: What Drives the Range?

Cost variability in Odoo ERP implementation comes from five compounding factors:

  • Configuration vs. Customization Ratio: Using Odoo Studio to configure fields costs $2,000–$8,000. Writing custom Python modules costs $15,000–$50,000+ because you’re hiring developers, not configurators.
  • Number of Integrations: Each integration point adds 20–40 hours of scoping, development, testing, and ongoing maintenance. A company integrating with Shopify, ShipStation, and QuickBooks will spend $25,000–$45,000 on middleware and APIs.
  • User Training Depth: Basic click-through training costs $50–$100/user. Functional training (teaching users why processes changed) costs $200–$350/user because you’re training organizational change, not software navigation.
  • Data Migration Complexity: Migrating 5 years of transactional data with clean schemas costs $5,000–$15,000. Migrating 15 years of inconsistent data across 3 legacy systems costs $30,000–$70,000 because you’re funding data archaeology and reconciliation.
  • Geographic Distribution: Single-site implementations cost 30–40% less than multi-site rollouts because each location adds coordination overhead, travel costs, and training duplication.

Godlan’s manufacturing ERP commentary cites scope creep as a recurring driver of overruns, especially when planning and requirements are weak.

How much does data migration cost for Odoo?

Data migration for Odoo typically lands at $5K–$15K when you migrate a clean subset (masters + 1–3 years of transactions). It climbs to $30K–$70K when data lives across multiple systems, SKU/BOM structures are inconsistent, or inventory/accounting history must reconcile to the penny.

The real cost driver isn’t “moving data”; it’s remediation, validation, and reconciliation, so reports and financials match what leadership expects on day one.

How much do integrations cost in Odoo?

Most Odoo integrations fall in the $8K–$25K range when APIs are mature, and data mapping is straightforward. Costs increase when middleware, custom transformations, or compliance testing is required; EDI is the usual multiplier. Ongoing maintenance also matters: plan roughly 10–15% of build cost per year for API changes, platform updates, and break/fix.

How much does Odoo customization cost?

Light customization (new fields, layouts, automations using Odoo Studio or configuration) often fits into $2K–$8K. Custom Python modules usually start around $15K and can exceed $50K when they change core logic, add workflows, or require heavy testing and upgrade-proofing. Every customization becomes a long-term maintenance and upgrade cost, not just a one-time build.

Find Out What Your Odoo Project Will Actually Cost

Our Odoo consultants map your users, modules, data, and integrations to a realistic implementation budget.

Get My Cost Range


Total Cost of Ownership (TCO): Beyond Implementation

Odoo ERP pricing discussions often fixate on per-user license fees, but that represents only 20–30% of your 3-year cash outlay. The TCO framework forces visibility into the full capital structure:

TCO = Implementation + Licenses + Hosting + Support + Internal Labor + Opportunity Cost

For a 50-user company, that typically means:

3-Year Odoo TCO Model (50-User Enterprise Deployment)

Cost Category Year 1 Year 2 Year 3 3-Year Total % of TCO
Implementation Services $65,000 $0 $0 $65,000 32%
Software Licenses (Enterprise) $20,000 $20,000 $20,000 $60,000 30%
Hosting & Infrastructure $3,600 $3,600 $3,600 $10,800 5%
Support & Enhancements $12,000 $15,000 $15,000 $42,000 21%
Internal Labor (Allocated) $15,000 $5,000 $5,000 $25,000 12%
Total 3-Year TCO $115,600 $43,600 $43,600 $202,800 100%

Upfront Implementation Costs (One-Time Investment)

The Odoo implementation cost one-time outlay breaks into five capital deployment categories:

Phase Cost Range What You’re Buying Failure Risks
Discovery & Gap Analysis $5,000 – $18,000 Process mapping, requirements documentation, gap analysis Inadequate discovery leads to rework costing 5× more later
Configuration & Data Migration $10,000 – $35,000 Module setup, field mapping, ETL processes, data validation Bad data creates permanent reporting and inventory issues
Customization & Integration $15,000 – $80,000+ Custom modules, API development, third-party connectors Over-customization creates long-term maintenance and upgrade risk
Training & Change Management $6,000 – $25,000 Functional training, documentation, process coaching Under-trained users create workarounds and adoption failure
Testing & Go-Live Support $8,000 – $30,000 UAT, performance testing, go-live war room, stabilization Insufficient testing causes production failures at launch

Key Insight: Companies with robust change management programs see better outcomes. Research from Harvard Business Review Analytic Services shows that 89% of executives consider driving adoption of employee-facing software essential (HBR Analytic Services), yet only 30% rate their organizations as highly effective at software adoption.

Ongoing Operational Costs (Annual Recurring)

In practice, most partners price ongoing Odoo maintenance at roughly 6–7% of total implementation value annually, scaling with customization and integrations.

After go-live, your Odoo ERP pricing annual spend stabilizes around:

Annual Recurring Costs = Licenses + Hosting + Support + Continuous Improvement

For a 50-user deployment:

  • Licenses (Enterprise Standard): $18,660–$22,950/year (based on Odoo’s official pricing: $31.10/user/month × 50 users)
  • Hosting (Odoo.sh or AWS): $3,600–$9,600/year, depending on transaction volume
  • Support Retainer: $1,000–$2,500/month ($12,000–$30,000/year) for bug fixes, minor enhancements, and user support
  • Version Upgrades: $8,000–$20,000 every 18–24 months to stay current with Odoo releases

Total Annual Run Rate: $42,000–$82,000/year

The hidden cost here is internal operational overhead: someone must manage user permissions, run month-end close, troubleshoot integration failures, and prioritize enhancement requests. Budget 0.5–1.0 FTE for ongoing Odoo administration.

What does Odoo support cost after go-live?

Most organizations should plan $1K–$2.5K per month ($12K–$30K per year) for bug fixes, small enhancements, and user support, depending on integrations and customization. Without a support budget, companies end up paying emergency rates when month-end issues, workflows, or integrations break under real usage.

Do I have to pay for Odoo hosting?

Yes, hosting depends on the deployment model. For most mid-market systems, budget $3.6K–$9.6K per year for Odoo.sh or cloud infrastructure, depending on usage, storage, and environments. Self-hosting may look cheaper, but you then own backups, patching, monitoring, and security. For finance teams, the real question is who carries uptime and risk.

Hidden Costs Most Buyers Miss

These cost categories rarely appear in vendor proposals but consistently emerge during rollout:

  1. Data Cleansing & Enrichment ($8K–$40K): Deduplicating customers, standardizing product codes, reconciling inventory balances before migration
  2. Process Re-Engineering ($12K–$35K): Redesigning workflows to fit Odoo’s logic rather than forcing Odoo to fit broken processes
  3. Delay Costs ($15K–$80K+): Extended parallel runs of legacy and new systems while teams “get comfortable” with Odoo
  4. Rework from Scope Creep ($12K–$50K): Mid-project requests like “Can we add custom approvals?” that cascade through configuration, testing, and training
  5. Integration Maintenance (10–15% of integration cost annually): APIs break, data schemas change, third-party platforms deprecate endpoints
  6. Internal Labor During Rollout: Your employees spend 200–500 hours in meetings, testing, and data validation, which is $25K–$65K in loaded labor costs

As one COO at a $45M distribution company told us: “We budgeted $70K for Odoo. We spent $115K because we didn’t account for our own time, and that time was when we learned our processes were broken.”

Avoid Cost Overruns in Your Odoo Implementation

Our Odoo development company helps enterprises identify hidden costs before contracts are signed, including data cleanup, integrations, and internal workload.

Review My Odoo Plan


Odoo Pricing Models: Community vs Enterprise Cost Analysis

Understanding Odoo pricing 2026 requires distinguishing between software licensing and total deployment cost. Odoo’s pricing model offers three paths, each with vastly different TCO implications.

According to Odoo’s official pricing page, Odoo Enterprise pricing per user 2026 is structured as follows:

Edition License Cost Hosting Support Best For Typical 3-Year TCO (50 Users)
Community $0 Self-hosted ($300–$1,000/month) Third-party or internal Technical teams with in-house developers $90K – $170K
Enterprise Standard ~$31/user/month ($18,660/year) Odoo Online Email & ticket Single-entity, low-customization deployments $150K – $230K
Enterprise Custom ~$61/user/month ($36,600/year) Odoo.sh or on-prem Enhanced + SLA Multi-entity, integrations, and custom workflows $220K – $350K+

The counterintuitive reality: Community Edition often costs more to deploy because you’re funding all customization and support out of pocket. Enterprise licenses include Odoo Studio (low-code customization), automatic upgrades, and technical support, capabilities that save $18K–$45K in Year 1 alone.

Why Community Is Often the Most Expensive Option

“Free” Community Edition only means no license fee. It does not mean free ownership.

A typical Community deployment requires:

  • Implementation partner: $35K–$90K+
  • Self-hosting (AWS / DigitalOcean): $400–$1,200/month
  • Support retainer: $1,500–$3,500/month
  • Upgrades every 18–24 months: $12K–$35K

Because there is no Odoo support, no Studio, and no managed upgrades, every problem becomes a billable engineering task. Over three years, Community almost always costs more than Enterprise Standard for non-technical organizations.

Community only makes sense when:

  • You have in-house Python and PostgreSQL developers
  • You are running ≤3 modules
  • You accept managing servers, security, and upgrades yourself

Enterprise Standard vs Enterprise Custom

Odoo Enterprise is sold in two functional tiers.

Enterprise Standard (~$31/user/month)

Includes:

  • All Odoo business apps
  • Odoo Online hosting
  • Email & ticket support
  • Automatic upgrades

Best for:

  • Single-entity companies
  • Standard accounting, sales, and inventory
  • Minimal customization
  • No need for multi-company or API integrations

Enterprise Custom (~$61/user/month)

Includes everything in Standard plus:

  • Odoo Studio (low-code customization)
  • Multi-company support
  • External API access
  • Odoo.sh or on-prem hosting
  • Advanced deployment and scaling options

This tier is required for:

  • Multi-entity accounting
  • Custom workflows
  • Integrations (Shopify, EDI, Salesforce, WMS)
  • Industry-specific compliance and controls

Important:

Most mid-market and enterprise Odoo implementations fall into Enterprise Custom, even if sales quotes start at “Standard” pricing.

Which Edition Is Right for Your Budget?

Decision logic for finance leaders:

Choose Community if:

  • Annual revenue <$3M and IT budget <$40K
  • You have in-house developers (Python, PostgreSQL)
  • You’re implementing ≤3 modules with standard workflows
  • You can self-manage hosting and security

Choose Enterprise Standard if:

  • Annual revenue $3M–$75M
  • You need 5+ modules and a moderate configuration
  • You lack in-house ERP development talent
  • You want predictable costs and vendor accountability

Choose Enterprise Custom if:

  • Annual revenue >$75M or multi-entity structure
  • You need Odoo Studio for ongoing customizations
  • You’re replacing SAP, Oracle, or another Tier-1 ERP
  • Compliance mandates audit trails and role-based access controls

Capital Allocation Rule of Thumb: Many mid-market ERP business cases model Year-1 spend as a low single-digit % of revenue, depending on operational complexity. A $40M company should plan $400K–$1.2M for a full-scale ERP transformation, including licenses, implementation, and first-year support.


Phase-by-Phase Implementation Cost Breakdown

The Odoo implementation cost structure follows a predictable five-phase capital deployment model. Understanding each phase helps prevent the ‘we’re 80% done but 200% over budget’ trap, a pattern that frequently turns ERP programs into over-budget, delayed projects. (Standish Group CHAOS Report).

Phase 1: Discovery & Gap Analysis ($5,000–$18,000)

Duration: 2–4 weeks
Deliverables: The functional consultant makes a requirements document, process maps, gap analysis, and project charter

This phase determines whether you spend $50K or $200K total. Poor discovery leads to scope creep, rework, and failed go-lives.

What you’re buying:

  • Current-state process documentation (as-is workflows)
  • Future-state process design (to-be workflows aligned with Odoo)
  • Data migration strategy (source systems, data quality assessment)
  • Integration architecture (API mapping, middleware selection)
  • Change management plan (training approach, communication cadence)

Cost drivers:

  • Business complexity: Multi-entity structures, complex approvals, and regulatory requirements add 30–50% to discovery time
  • Documentation maturity: Companies with ISO 9001 or documented SOPs finish discovery faster
  • Stakeholder alignment: Each additional approval layer adds 1–2 weeks

Where money gets burned: Skipping process re-engineering. If you automate broken processes, you’ve just built an expensive broken system.

What does an Odoo discovery workshop cost?

Discovery is normally a paid phase because it defines scope, migration rules, integration architecture, and risk controls. Your $5K–$18K range reflects what it takes to produce a real project blueprint. When discovery is “free,” the cost is usually recovered later through change orders or inflated delivery hours.

This aligns with how most Odoo partners scope discovery: a paid gap analysis phase led by a functional consultant, typically ranging from $10K–$20K for mid-to-large implementations.

Phase 2: Configuration & Setup ($10,000–$30,000)

Duration: 3–6 weeks
Deliverables: Configured Odoo instance, chart of accounts, product catalog, and user roles

What you’re buying:

  • Module installation and base configuration
  • Chart of accounts and fiscal year setup
  • Product/service catalog structure
  • Warehouse and location configuration
  • User roles and permissions architecture
  • Email templates and document layouts

Cost drivers:

  • Number of modules: Each additional module adds 5–10 hours of configuration
  • Data volume: Migrating 50,000 SKUs vs. 500 SKUs changes data migration costs by 10x
  • Localization complexity: Multi-currency, tax jurisdictions, and statutory reporting add 20–40 hours

Configuration vs. Customization Decision Point: Out-of-the-box Odoo handles 80% of standard business processes. The temptation to customize “just this one thing” is where costs explode. Each customization adds technical debt that compounds during upgrades.

Phase 3: Customization & Integration ($15,000–$50,000+)

Duration: 4–10 weeks
Deliverables: Custom modules, third-party integrations, automated workflows

This is the highest-cost, highest-risk phase, accounting for about 90% of the total project cost. Odoo implementation cost variability stems primarily from customization scope.

What you’re buying:

  • Custom Python module development ($5,000–$25,000 per module)
  • Third-party integrations ($8,000–$25,000 each: Shopify, Salesforce, EDI, payment gateways)
  • Advanced reporting and dashboards ($3,000–$10,000)
  • Workflow automation (approval routing, notifications, scheduled actions)
  • API development for legacy system interfaces

Cost drivers:

  • Integration complexity: REST APIs are cheaper than SOAP or EDI. Legacy systems without APIs require custom middleware ($20K–$60K)
  • Customization depth: Modifying core Odoo logic vs. extending with new modules
  • Performance optimization: High-volume transactional systems need database tuning and caching ($10K–$25K)

Real-world example: A $30M medical device distributor needed EDI integration with 3 hospital systems. Initial quote: $25,000. Final cost: $68,000 because each hospital used different EDI standards, required separate testing environments, and had compliance documentation requirements not scoped upfront.

Risk mitigation: Allocate 30% contingency budget for customization phases. Customization always takes longer than estimated.

How much contingency should we budget for Odoo?

For projects with integrations and customization, finance teams should plan 25–30% contingency to cover data cleanup, scope clarification, and UAT discoveries. Zero contingency almost always turns into unplanned budget later. Disciplined, mostly out-of-the-box deployments can run lower, but never zero.

Phase 4: Training & Change Management ($5,000–$20,000)

Duration: 2–4 weeks
Deliverables: Trained users, documentation, and change champions

What you’re buying:

  • Executive/leadership orientation (2–4 hours)
  • Functional training by role (8–16 hours per user cohort)
  • Train-the-trainer sessions (if building internal capacity)
  • User documentation and quick reference guides
  • Change management communication plan

Cost drivers:

  • User count and geographic distribution: Training 50 users in one location vs. 10 locations changes costs by 3x
  • Training depth: Click-training costs $80/user. Process training costs $250–$400/user because you’re teaching why workflows changed
  • Custom functionality: Each custom module adds 2–4 hours of training content development

The hidden ROI: Teams that fund training and super-user coverage consistently see faster adoption and fewer post-go-live tickets.

Common mistake: Training too early. Users forget. Train within 2 weeks of go-live for maximum retention.

Phase 5: Testing, Go-Live & Support ($10,000–$25,000)

Duration: 3–6 weeks
Deliverables: UAT sign-off, cutover plan, go-live support, stabilization

What you’re buying:

  • User acceptance testing (UAT) coordination
  • Performance and load testing
  • Cutover planning (legacy system freeze, data migration, go-live weekend)
  • Go-live war room support (48–72 hours of intensive support)
  • Post-go-live stabilization (2–4 weeks hypercare)

Cost drivers:

  • Data migration volume: Migrating 10 years of transactional history takes 3–5x longer than 2 years
  • Parallel run duration: Running old and new systems simultaneously doubles operational overhead
  • Go-live timing: Month-end or year-end go-lives add risk and cost

Risk profile: Many ERP failures occur during or shortly after go-live due to inadequate testing and premature cutover.

Go-live decision criteria:

  • UAT sign-off from all department heads
  • Data migration validated with <0.5% error rate
  • All critical integrations tested end-to-end
  • Executive steering committee approval
  • Rollback plan documented

Stabilization reality: Budget 2–4 weeks of intensive support post-go-live. Users will discover edge cases, data issues will surface, and integrations will fail under production load. This is normal. The question is whether you budgeted for it.


Real-World Cost Examples: Small, Medium & Enterprise Scenarios

These scenarios reflect the actual cost of Odoo implementation projects, with costs and timelines based on engagements across manufacturing, distribution, and professional services sectors.

Small Business (10-20 Users): $15,000-$35,000

Profile: Regional e-commerce retailer, 15 employees, $3M annual revenue

Modules Implemented: Accounting, Sales, CRM, Inventory, eCommerce (Shopify integration)

Cost Breakdown:

  • Discovery & Gap Analysis: $3,500
  • Configuration: $8,000
  • Shopify Integration: $6,500
  • Training (15 users): $2,400
  • Go-Live Support: $3,200
  • Total: $23,600

Timeline: 10 weeks from kickoff to go-live

Key decisions that kept costs low:

  • Used Odoo Enterprise Standard (no custom development)
  • Accepted out-of-box workflows with minor configuration
  • Owner served as internal project manager (no PM fees)
  • Single-site operation (no travel costs)

CFO insight: “We almost customized our sales commission logic. That would have added $12K and 6 weeks. Instead, we changed our commission policy to match Odoo’s standard calculation. That policy change took 2 hours and saved us $12,000.”

Mid-Size Company (50 Users): $50,000–$100,000

Profile: Contract manufacturer, 50 employees, $28M annual revenue

Modules Implemented: Accounting, Inventory, Manufacturing (MRP), Purchase, Quality, PLM

Cost Breakdown:

  • Discovery & Gap Analysis: $12,000
  • Configuration & Data Migration: $18,500
  • Custom BOM Configuration: $14,000
  • Quality Module Customization: $8,500
  • Training (50 users, 3 cohorts): $11,000
  • Go-Live & Stabilization: $15,000
  • Total: $79,000

Timeline: 16 weeks from kickoff to go-live

What drove costs:

  • Complex bill-of-materials with routing logic
  • Integration with the existing quality management system (QMS)
  • Multi-step approval workflows requiring custom development
  • Two-site rollout (primary facility, then satellite warehouse)

COO insight: “The $14K we spent on custom BOM logic paid for itself in 4 months through reduced material waste. But the $8,500 we spent on custom quality workflows? In hindsight, we should have changed our quality process to match the Odoo standard. That customization creates a maintenance burden forever.”

Enterprise (100+ Users): $150,000–$300,000+

Profile: Multi-entity healthcare distributor, 180 employees, $95M annual revenue

Modules Implemented: Accounting (multi-company), CRM, Sales, Purchase, Inventory (multi-warehouse), Rental, Field Service

Cost Breakdown:

  • Discovery & Gap Analysis: $28,000
  • Configuration & Setup: $35,000
  • EDI Integration (3 hospital systems): $42,000
  • Multi-company consolidation customization: $25,000
  • Data Migration (3 legacy systems): $31,000
  • Training (180 users, 8 cohorts): $24,000
  • Change Management Program: $18,000
  • Go-Live & Stabilization: $22,000
  • Total: $225,000

Timeline: 28 weeks from kickoff to go-live

What drove costs:

  • Multi-entity accounting with intercompany eliminations
  • HIPAA compliance requirements (audit trails, role-based security)
  • EDI integration complexity (each hospital has different protocols)
  • Legacy data cleanup (15 years of unreconciled transactions)
  • Phased rollout (HQ, then 3 distribution centers sequentially)

CFO insight: “We initially budgeted $140K based on vendor estimates. We hit $225K because we underestimated three things: data cleanup, EDI complexity, and internal labor during testing. Our finance team spent 400 hours validating data migration, that is $60K in loaded labor we didn’t budget. Next time, we’d allocate 40% more for data and integration, 20% less for software and configuration.”

Common pattern across all scenarios: Customization and integration drive 60–70% of cost variability. Companies that constrain customization to <20% of the project scope finish on time and on budget significantly more often than those exceeding 30% customization.


Cost Comparison: Is Odoo Cheaper Than SAP, Dynamics, or NetSuite?

“Is Odoo cheaper?” is the wrong question. The right question: “For our operational complexity and financial constraints, which ERP delivers the best risk-adjusted return?”

Odoo vs SAP Business One

Here’s a quick overview of odoo vs sap to help you make an informed decision:

Factor SAP Business One Odoo Enterprise (Standard to Custom) Cost Advantage
Licensing (50 users) $55,000 – $85,000 / year $18,660 – $36,600 / year Odoo: 50–60% lower
Implementation $120,000 – $250,000 $60,000 – $120,000 Odoo: 40–50% lower
Customization Complexity High (ABAP, Crystal Reports) Medium (Python, JavaScript) Odoo: easier to find developers
Hosting On-premise or certified hosts Odoo.sh or self-host Odoo: more flexibility
3-Year TCO (50 users) $285,000 – $505,000 $200,000 – $320,000 Odoo: 45–55% lower

When SAP makes sense: You’re a $500M+ manufacturing operation with complex global statutory reporting, multi-currency consolidation, and an existing SAP ecosystem (SAP already deployed elsewhere in the parent company).

When Odoo makes sense: You’re a $10M–$100M company prioritizing speed to value, operational agility, and lower total cost of ownership over brand-name ERP legacy.

According to a Nucleus Research report (Nucleus Research ERP Study), SMB companies switching from SAP Business One to Odoo reported 48% lower annual ERP costs while maintaining equivalent functionality for core financial and operational processes.

Odoo vs Microsoft Dynamics 365

Factor Dynamics 365 Business Central Odoo Enterprise (Standard to Custom) Cost Advantage
Licensing (50 users) $42,000 – $72,000 / year $18,660 – $36,600 / year Odoo: 35–55% lower
Implementation $80,000 – $180,000 $60,000 – $120,000 Odoo: 20–35% lower
Microsoft Ecosystem Integration Native (Office 365, Power BI, Azure) Requires connectors Dynamics: tighter integration
Customization Power Apps, AL language Python, Odoo Studio Comparable complexity
3-Year TCO (50 users) $206,000 – $396,000 $200,000 – $320,000 Odoo: 25–40% lower

When Dynamics 365 makes sense: You’re heavily invested in the Microsoft ecosystem (Azure, Office 365, Power Platform) and need seamless integration across productivity and business apps.

When Odoo makes sense: You’re platform-agnostic, prioritize open-source flexibility, or need deeper manufacturing/PLM capabilities that Dynamics requires third-party ISVs to deliver.

Why Odoo’s Open-Source Model Changes the Economics

Traditional ERP vendors (SAP, Oracle, Microsoft) monetize through:

  1. License fees (perpetual or subscription)
  2. Maintenance fees (18–22% of license cost annually)
  3. Professional services (implementation, customization, training)
  4. Upgrade fees (forced migrations every 5–7 years)

Odoo’s open-source model changes the equation:

No vendor lock-in: You can switch implementation partners mid-project without renegotiating licenses. This creates competitive pricing pressure on service delivery.

While custom modules are typically maintained by the implementation partner, Odoo’s open-source architecture ensures long-term access, extensibility, and portability of your system.

Community innovation: 40,000+ third-party modules exist in the Odoo App Store. Many common requirements (EDI, shipping integrations, advanced reporting) have pre-built solutions costing $0–$500 vs. $15,000–$40,000 for custom development.

Transparent pricing: Odoo’s per-user pricing is published. SAP and Oracle pricing require NDA’d negotiations and complex licensing audits.

Lower switching costs: If Odoo doesn’t fit after 2 years, your data export is straightforward (PostgreSQL database, standard formats). Switching from SAP typically requires significant data extraction, migration, and re-implementation effort, often costing six figures for mid-market organizations.

Total economic impact: Forrester’s Total Economic Impact studies consistently show that mid-market organizations selecting modern, open-architecture ERP platforms achieve lower implementation costs, faster time-to-value, and stronger long-term ROI than those deploying Tier-1 ERP stacks

But open-source introduces risk: You must select implementation partners carefully. Poor partner selection negates cost advantages through rework and project failure.


7 Proven Strategies to Reduce Your Odoo Implementation Costs

These strategies reflect patterns seen across hundreds of Odoo implementations in manufacturing, distribution, professional services, and healthcare.

Strategy 1-3: Planning & Scoping

1. Conduct Ruthless Process Simplification Before Configuration

The #1 cost driver is automating complexity. Before you configure Odoo to match your current workflows, ask: “Why do we do it this way?”

Action: Document current processes, then challenge every approval step, every custom field, every exception workflow. Eliminating one approval layer can save $5,000–$15,000 in customization and ongoing maintenance.

ROI example: A $40M distributor eliminated 3 approval steps in their purchase order process, reducing PO cycle time from 4 days to 6 hours and saving $22,000 in custom workflow development.

2. Adopt the 80/20 Rule: Accept Standard Functionality

If Odoo’s out-of-the-box logic handles 80% of your requirements, accept it. Customizing the remaining 20% often costs more than the operational friction of changing your process.

Decision framework:

  • Will this customization generate >$50K annual benefit? If no, don’t build it.
  • Can we achieve the same outcome by changing our process? If yes, change the process.
  • Will this customization block future Odoo upgrades? If yes, find an alternative.

Cost avoidance: Companies that tightly constrain customization consistently spend significantly less and deliver faster than those that allow scope to exceed core business needs.

3. Build a Full-Time Internal Project Team

The most underestimated cost reduction lever: dedicating internal resources. Companies that assign a full-time project manager and functional SMEs from each department spend 30–40% less on implementation partners because they provide:

  • Clear requirements (reduces discovery time)
  • Fast decision-making (reduces project delays)
  • Data expertise (reduces migration errors)
  • Change management (reduces post-go-live support)

Budget allocation: Expect 800–1,500 hours of internal labor during implementation. For a 6-month project, that’s 2–3 FTEs. Budget $80K–$150K in loaded internal labor costs.

Strategy 4-7: Execution & Partnership

4. Select Implementation Partners Based on Industry Expertise, Not Price

Hourly rates range from $40/hour (offshore) to $250/hour (US-based specialists). But the cheapest partner is rarely the least expensive project.

Partner evaluation criteria:

  • Industry experience: Have they implemented Odoo in your vertical? (Manufacturing, distribution, healthcare, etc.)
  • Odoo certification level: Gold/Silver partners have proven delivery track records
  • Reference checks: Speak to 3+ clients with similar company size and complexity
  • Resource stability: High consultant turnover = knowledge loss mid-project

Real cost comparison:

  • Offshore partner at $40/hour: Quoted 1,000 hours = $40,000. Actual: 1,800 hours = $72,000 due to communication overhead, rework, and time zone delays.
  • US specialist at $150/hour: Quoted 400 hours = $60,000. Actual: 450 hours = $67,500. Finished 6 weeks faster with fewer defects.

Net outcome: The “expensive” partner cost 7% less and delivered 40% faster.

5. Phase Your Rollout: Start Small, Prove Value, Then Scale

Instead of implementing 12 modules across 4 locations simultaneously, implement 4 modules at 1 location, stabilize, then roll out.

Phased approach benefits:

  • Reduced risk: Failures impact 25% of organization, not 100%
  • Faster learning: Lessons from Phase 1 improve Phase 2 efficiency
  • Improved cash flow: Spread capital outlay over 12–18 months vs. 6 months
  • Higher adoption: Early wins build organizational confidence

Cost impact: Phased rollouts are widely recommended in ERP risk management because they limit blast radius and allow early learning before full-scale deployment.

6. Invest Heavily in User Training (Not Just Software Training)

Budget 12–15% of the total project cost for training. Most companies budget <8%.

Training approach:

  • Software training: How to click buttons (2–4 hours per user)
  • Process training: Why workflows changed and what it means for daily work (6–8 hours per user)
  • Change champions: Train 10–15% of users as super-users who support peers post-go-live

ROI: Companies allocating >12% of budget to training achieve:

  • Faster adoption (weeks, not months)
  • Fewer workarounds and fewer post-go-live tickets
  • Less dependency on external support for routine questions

7. Establish a Realistic Support & Enhancement Budget

After go-live, budget $1,500–$3,000/month for ongoing support. This covers:

  • Bug fixes and troubleshooting
  • User questions and process guidance
  • Minor enhancements (new reports, workflow tweaks)
  • Version upgrade planning

Common mistake: Assuming the implementation partner will provide free support post-go-live. They won’t. Either negotiate a support retainer or budget $30K–$50K/year for ad-hoc support billing.

Long-term cost control: Establish an internal Odoo administrator (0.5–1.0 FTE) who handles routine changes, user provisioning, and integration monitoring. This reduces reliance on external consultants by 60–70%.


Making Your Odoo Investment Decision

Odoo implementation cost is not a software purchasing decision; it’s a capital investment in operational transformation. The companies that achieve ROI treat it as such: with rigorous business case development, disciplined scope management, allocated internal resources, and realistic risk assessment.

The core insight: You’re not buying Odoo licenses for $31/user/month. You’re funding a 4–18 month project to redesign how your company operates.

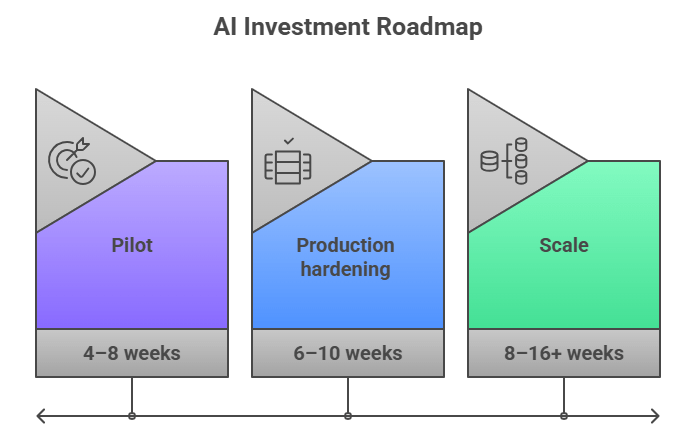
Most rollouts land in the 8–32 week band; 12–18 months typically show up when the program includes multi-site sequencing, heavy integrations, or deep process redesign.

That project will cost:

  • Small business (10–20 users): $15,000–$40,000 over 8–14 weeks
  • Mid-market (50 users): $50,000–$100,000 over 16–24 weeks
  • Enterprise (100+ users): $120,000–$250,000+ over 24–32 weeks

3-Year TCO Financial Model

For finance teams building business cases, use this framework:

Year 1 Cash Outlay:

  • Implementation services (discovery, configuration, customization, training, go-live)
  • First-year licenses (prorated based on go-live month)
  • Initial infrastructure setup
  • Internal labor allocation (project team time)

Years 2-3 Annual Run Rate:

  • Annual license fees ($18,660–$36,600 for 50-user Enterprise deployment)
  • Hosting and infrastructure ($3,600–$9,600/year)
  • Support and enhancement retainer ($12,000–$30,000/year)
  • Internal Odoo administrator (0.5–1.0 FTE)
  • Upgrade event cost (every 18–24 months: $8,000–$20,000)

Total 3-Year TCO Formula:

TCO = Implementation + (Annual Licenses × 3) + (Annual Support × 3) + (Hosting × 3) + Internal Labor + Upgrades

The variables that drive cost:

  • Scope discipline: Constrain customization, accept standard functionality
  • Data quality: Clean data migrates faster and cheaper
  • Internal capacity: Dedicated project team reduces consultant dependency
  • Partner selection: Industry expertise and delivery track record matter more than hourly rates
  • Change management: Trained, engaged users = faster adoption and ROI

The question isn’t whether Odoo is affordable. The question is whether your organization has the operational maturity and financial discipline to execute ERP transformation successfully.

Next Steps for Decision-Makers

If you’re a CFO, CTO, or COO evaluating Odoo:

  1. Build a realistic business case: Use the TCO framework in this guide to model 3-year costs
  2. Assess organizational readiness: Do you have clean data, documented processes, and executive alignment?
  3. Vet implementation partners: Interview 3–5 Odoo development companies with industry-specific experience
  4. Secure adequate budget: Add 25–30% contingency for scope adjustments and hidden costs
  5. Commit internal resources: Allocate a full-time project team or accept higher consultant costs

The difference between a $65K successful Odoo implementation and a $180K failed one often comes down to execution discipline: realistic scoping, dedicated internal resources, appropriate partner selection, and comprehensive change management.

In most cases, the cost difference comes down to execution duration and customization scope, not software licensing or user count.

When evaluating partners, look for firms that demonstrate financial literacy—those who speak your language of TCO, payback periods, and operational ROI rather than just technical features. The right partner prevents the cost overruns and failed implementations that plague ERP investments.

Work With an Odoo Development Company That Understands Finance

AppVerticals helps CFOs, COOs, and CTOs deploy Odoo with a controlled scope, predictable cost, and measurable ROI.

Start My Odoo Project

AI in EdTech: What Works in Production, What Fails, and Why

In 2026, AI in EdTech delivers value when models are allowed to override static curricula, like skipping, repeating, or reordering learning paths based on failure patterns. Teams that limit AI to recommendations or content generation rarely see measurable impact beyond experimentation.

EdTech companies are using AI in production to make three decisions that directly move learning outcomes and revenue: what a learner sees next, when an assessment adapts, and when intervention is triggered. 

I’ve seen the difference, like teams get ROI when AI is wired into progression + assessment logic, not bolted on as “features.” 

The spend is following that reality: the AI in education market is projected to grow $32.27B by 2030, ~31.2% CAGR

As an edtech app development company, this is the layer we evaluate first. 

Key Takeaways

  • AI in EdTech delivers ROI only when it controls progression, assessment adaptation, and intervention timing, not when it’s limited to recommendations or content generation.

  • Adaptive learning and assessment automation are the highest-impact use cases, with engagement and completion gains of 20–40% when tied to mastery signals.

  • Most failures are execution failures, caused by weak data pipelines, lack of monitoring, early overengineering, and ignoring governance until scale.

  • Hybrid AI architectures outperform pure LLM stacks, using traditional ML for high-frequency decisions and LLMs selectively for feedback and content.

  • Education app development cost rises at production scale due to integration, compliance, and monitoring, with realistic AI budgets ranging from $60k to $1M+.

  • AppVerticals helps EdTech teams move AI from experimentation to production, leveraging deep EdTech delivery experience across 200+ education solutions serving 20M+ learners.

How are successful companies actually using AI in Edtech production today?

They’re using AI to make high-leverage product decisions inside the learning flow, like personalization, assessment/feedback, and content operations, because those are the only places AI reliably moves outcomes at scale.

A quick reality check from what I see in real deployments: “AI features” don’t create the lift. Decision automation does, especially when it’s tied to progression rules, mastery thresholds, and intervention triggers (not just recommendations).

How does AI-driven personalization work in real EdTech platforms at scale?

It works by using behavioral learning signals (not demographics) to decide what content comes next, how difficulty adjusts, and when the platform should slow down or accelerate.

AI-driven personalized learning systems have been shown to increase student engagement and retention by up to ~30% by adapting lessons to learner performance in real time. It is an evidence that production-grade decision automation (not superficial features) changes core learning outcomes.

Furthermore, An EDUCAUSE survey of more than 800 higher-education institutions found 57% are prioritizing AI implementation in 2025, up from 49% in the prior year, signaling that successful organizations are integrating AI into core workflows rather than treating it as an experiment.

In multi-region platforms, the personalization stack that holds up in production usually looks like this:

Diagram (what actually runs in production):
AI in Edtech Workflow Personalization

A systematic review of recent studies confirms that personalized AI models can significantly enhance student engagement and tailored learning experiences, demonstrating measurable benefits across diverse contexts.

What’s “real” about this is the feedback loop: personalization systems only improve when they’re continuously evaluated against outcomes (completion, mastery, retention), not just click-through.

How are EdTech companies using AI for automated assessments and feedback?

They’re using AI to compress the feedback cycle, like auto-grouping, rubric-based scoring support, and faster iteration on misconceptions, so instructors spend time on judgment, not clerical grading.

For many teams, this directly addresses one of the most persistent education app development challenges, such as scaling assessment and feedback without increasing instructor workload or compromising trust.

Recent reviews highlight that AI tools in education are increasingly linked to personalized instruction and enhanced learning outcomes, specifically in adaptive testing and feedback. A pattern seen across higher education and professional upskilling environments. 

Workflow (how it’s typically deployed without breaking trust):

AI-Driven Assessment Workflow

Teams that get adoption don’t oversell “auto-grading.” They position it as speed + consistency + auditability, with human override baked in, because credibility is the product in EdTech.

How is AI improving content creation and instructor productivity in EdTech?

It improves productivity when it’s used for structured drafts, variants, and alignment work (objectives, rubrics, question banks), not when it’s asked to invent pedagogy from scratch.

While generative productivity results vary by implementation, broader AI productivity research shows that AI adoption can increase productivity outcomes and task completion speed across knowledge work by substantial margins

What “good” looks like in production content ops:

  • AI drafts + humans approve (quality gate) 
  • Versioning and citation rules (academic integrity) 
  • Measured impact: faster course updates + more consistent assessment materials 

The key pattern I see: the wins come from reducing latency in content operations, not “AI-generated courses.” Production teams treat AI as an accelerator inside a governed workflow.

Which AI use cases in EdTech deliver real ROI instead of experimental features?

The AI use cases that actually move financial and learning metrics are those that optimize learner flows, reduce friction, and automate predictable decisions. 

A study from McKinsey finds that personalized learning implementations can improve engagement by 20–40% and lift completion metrics as well. 

Below we break down what actually works, what looks good but doesn’t scale, and how leaders decide where to invest next. 

Which AI features consistently improve retention and learner engagement?

Adaptive sequencing and mastery-based adjustments are the AI features most consistently tied to improved retention and engagement. 

Platforms that permit the system to reprioritize content based on mastery signals, show measurable effects on learner behavior. 

In third-party evaluations, students using DreamBox’s adaptive learning model showed measurable gains in engagement and achievement, particularly when usage crossed defined weekly thresholds. 

In practice this means:

  • Learner gets additional practice on missed objectives automatically
  • Advancement only when performance crosses mastery thresholds
  • Content difficulty adapts with predictive models tied to engagement signals

These systems go beyond “recommendations” and become part of a closed-loop learning engine, which is where the measurable engagement lifts come from.

Which AI use cases look impressive but fail adoption tests?

Standalone conversational tutors and generic AI assistants often fail to move engagement because they don’t change core decision points in learning workflows.

Common failure modes include:

  • High initial use, low sustained engagement
  • Lack of integration with mastery signals
  • Teacher teams ignoring the tutor because it doesn’t save time

These kinds of “impressive but inert” features can create FOMO but rarely deliver measurable business or learning outcomes at scale.

How do EdTech leaders decide which AI initiatives to fund first?

EdTech leaders prioritize AI initiatives based on impact vs. implementation risk, with clear signals on retention, cost savings, or operational leverage.

In Series B or later startups, the AI roadmap often looks like:

  1. Adaptive sequencing & assessment automation (highest direct impact)
  2. Predictive analytics for churn/engagement (diagnostic lift)
  3. Content generation for templated assets (throughput lift)
  4. Conversational interfaces (ROI optional, often labeled “nice to have”)

A useful real-world signal comes from Duolingo’s public disclosures. In 2025, the company shared that AI tooling allowed it to launch over 140 new courses in roughly a year, compared to more than a decade to reach its first 100 courses. 

The AI investment paid off not because it improved “conversation,” but because it collapsed content production timelines, a direct operational ROI.

So, making an app like duolingo, can be significant for the relevant audience. 

Practical guidelines leaders use:

  • Score initiatives on measurable impact (retention, completion, time saved)
  • Assess data readiness (can we measure mastery signals reliably?)
  • Evaluate integration risk (can this operate inside the product’s core workflows?)

The goal is to fund what moves the needle on KPIs your board and customers actually care about, not just the glossy demos.

What AI architecture makes sense for a scalable EdTech platform without overengineering?

A hybrid architecture works best: use traditional ML for high-volume decisions (scoring, routing, risk), and LLMs only where language adds value (explanations, feedback, content transforms).

The practical reason is cost + latency control: LLM calls are metered per token, so you don’t want your core “every click” pathway to depend on them. OpenAI’s published API pricing makes the unit economics explicit (priced per 1M tokens and model tier).

Should EdTech platforms use LLMs, traditional ML, or hybrid AI architectures?

Hybrid wins for most scalable EdTech products: ML runs the decision engine; LLMs handle language and edge cases.

Decision table (what to use where):

Need Best Fit Why It Holds Up in Production
Next-step progression, mastery scoring, churn risk, intervention triggers Traditional ML Fast, cheap per call, consistent, easier to test
Feedback phrasing, explanations, rubric-aligned comments, content rewriting LLMs Language quality and adaptability
Assessment pipelines (detect misconception and generate feedback) Hybrid ML detects and flags; LLM drafts; human and guardrails approve

Rule I use in real builds: if the model runs on every learner event, it should be ML-first; if it runs on selected moments (feedback, explanation), LLMs are justified, especially when you can cache or batch calls using the pricing levers providers publish.

How should data pipelines be designed for AI-powered EdTech platforms?

Design pipelines so training and serving data stay consistent, and so you can monitor drift and retrain without rewriting the product.

McKinsey notes that 70% of top performers experienced difficulties integrating data into AI models (data quality, governance processes, training data). 

Stack diagram (production-friendly):

AI-powered edtech platform architecture

Google’s MLOps reference architecture is useful here because it treats monitoring as a first-class stage and explicitly frames production monitoring as the trigger for pipeline reruns and new experiment cycles.

And for drift specifically, Google highlights practical monitoring of skew (training vs serving) and drift over time, which is exactly what breaks EdTech models when cohorts, curricula, or seasonality shifts.

How do teams avoid overengineering AI in early-stage EdTech products?

Ship the smallest “decision loop” that moves one KPI, instrument it, and only then expand model scope.

Overengineering usually happens when teams build a complex AI platform before validating that the model can reliably change learner behavior or reduce ops cost.

Checklist (MVP AI rollout under 6 months):

  • Pick one outcome KPI (completion, time-to-mastery, instructor time saved)
  • Limit to one decision point (e.g., “next activity” or “intervention trigger”)
  • Start ML-first; add LLMs only for feedback text or content transforms
  • Build a fallback path (rules-based) and log every override
  • Define monitoring: drift + KPI movement (not just model accuracy)
  • Release in small increments and measure delivery performance (lead time, failure recovery) using established DevOps metrics 

Building AI into an EdTech platform?

Before you ship features, validate where AI should actually make decisions—progression, assessment, or intervention.

Talk to AppVerticals

How much does it realistically cost to implement AI in an EdTech product?

Realistically, the cost is driven less by “AI models” and more by product integration: data pipelines, evaluation, guardrails, and ongoing inference at scale.

That’s why budgets swing so widely between “pilot that looks good” and “production system that holds up.” 

McKinsey’s latest global survey is a good reality check: only 39% of organizations report enterprise-level EBIT impact from AI, even though many report use-case benefits, meaning a lot of spend still fails to translate into measurable business impact.

To make costs predictable, treat AI as three line items: build + integrate, run (inference/compute), and maintain (monitoring/retraining/governance)

What does AI implementation cost for startups vs scale-ups vs enterprises?

The tier difference is mostly about integration depth and governance, not “smarter AI.”

Cost table (implementation ranges you can budget around)

Company stage Typical scope that actually works Typical build budget (project) Ongoing run cost drivers
Startup (Seed–Series A) 1–2 decision loops (e.g., adaptive progression + feedback), minimal integrations $60k–$180k Token usage, logging, lightweight monitoring
Scale-up (Series B–C) Multi-cohort personalization + analytics, LMS/CRM integrations, evaluation harness $180k–$450k Higher usage + A/B testing, drift monitoring, stronger guardrails
Enterprise / modernization Legacy data unification, compliance controls, multi-region rollout, MLOps $450k–$1M+ Governance + auditability + monitoring at scale; security/compliance overhead

What this table really shows is how AI shifts the education app development cost in 2026 curve: the spend increases as products move from pilots to production, not because models are more advanced, but because reliability, compliance, and scale become non-negotiable.

Gartner forecasts worldwide AI spending at $2.52T in 2026, driven heavily by infrastructure and software, meaning the market is pricing in “production AI,” not cheap experiments.

How should AI investment be phased to reduce financial and technical risk?

Phase AI as “prove impact → harden systems → scale safely,” because most orgs don’t get enterprise EBIT lift without disciplined execution. 

AI in edtech investment roadmap - AppVerticals

  1. Pilot (4–8 weeks): ship one measurable decision (e.g., progression override or intervention trigger), run A/B, define success metrics.
  2. Production hardening (6–10 weeks): add evaluation harness, monitoring (drift + KPI), guardrails, fallback logic, caching/batching. Token and compute economics become visible here.
  3. Scale (8–16+ weeks): integrate into LMS/analytics stack, expand to more cohorts/regions, introduce governance + audit logs (especially if minors/regulated data are involved).

Is it cheaper to build AI in-house or partner with a specialized team?

It’s cheaper to build in-house only if you already have strong data + MLOps maturity; otherwise partnering is usually cheaper in time-to-value and rework avoided.

Matrix (staff augmentation vs delivery)

Option When it’s cheaper Hidden costs to watch
In-house build You already have data pipelines, evaluation discipline, and product ownership for AI Hiring and retention costs, ramp time, and “almost-right” models shipped without monitoring
Staff augmentation You need speed but can own architecture and governance internally Coordination overhead; continued need for an internal AI product owner
Specialized delivery partner You need end-to-end execution (data → model → integration → monitoring) on a deadline Vendor lock-in risk if pipelines, evaluations, and documentation aren’t transferable

76% of developers say they’re using or planning to use AI tools in their development process, like teams are already augmenting engineering with AI, but that doesn’t remove the need for strong delivery discipline in production AI. 

What are the biggest technical, data, and compliance risks when adding AI to EdTech?

The biggest risks are predictable: messy or unrepresentative learning data, model behavior you can’t reliably audit in production, and privacy/compliance exposure across regions.

For most EdTech teams, the risk isn’t “AI goes wrong once.” It’s that AI quietly becomes an ungoverned decision-maker inside learning and assessment flows, while usage scales faster than oversight. 

Here’s the risk matrix I see most often in real rollouts:

Risk matrix (what actually breaks production AI in EdTech):

  • High impact / high likelihood: data leakage + privacy, biased outcomes in scoring/recommendations, drift (models degrade as cohorts/curricula change)
  • High impact / medium likelihood: vendor/tooling lock-in, insecure integrations, weak incident response for AI-caused harm
  • Medium impact / high likelihood: hallucinated feedback/content, inconsistent outputs across languages/regions, “shadow AI” usage by staff

And don’t ignore governance/security costs when you scale. IBM reports the global average cost of a data breach is $4.4M, which is why mature AI rollouts budget for monitoring and controls early.

How do data quality and bias issues impact AI accuracy in EdTech?

They reduce accuracy in the exact places your product is judged: assessment decisions, progression logic, and intervention triggers, because bias and data gaps show up as “wrong outcomes,” not just lower model scores. 

In EdTech, bias usually enters through who your data represents (regions, languages, learning needs), how outcomes are labeled (what “mastery” means), and how feedback is generated (tone, appropriateness, and correctness).

UNESCO’s guidance on generative AI in education explicitly flags risks like fabricated information, improper handling of data, privacy breaches, unauthorized profiling, and bias.

Risk chart (common bias/data failure modes):

  • Coverage bias: one region/cohort dominates training data → weaker performance for GCC / EU / non-native English learners
  • Label bias: inconsistent rubrics or instructor grading differences → the model “learns” inconsistency
  • Proxy bias: engagement signals (time-on-task, clicks) accidentally encode socioeconomic constraints or accessibility needs
  • Feedback drift: model feedback quality degrades as content changes seasonally (new curriculum, new question bank)

How do EdTech companies manage AI compliance across regions?

They map data types and model behavior to the strictest applicable rules, then design one policy/architecture that satisfies all, instead of maintaining a different “AI” per region.

For your ICP (North America, Europe, GCC, Australia), the baseline reality is: you’re often dealing with student/learner data, and the compliance bar is high. 

Table (what “compliance alignment” means in practice):

Region / Framework What It Forces You to Do Practical AI Implication
US (FERPA) Controls disclosure of personally identifiable information from education records; gives rights to access/amend and limits disclosure Treat learner records as regulated; lock down model training data and sharing paths
EU (GDPR) Legal basis for processing, data minimization, purpose limitation, access/erasure rights, and cross-border transfer controls Build region-aware data handling, retention policies, and audit trails for AI decisions

If you’re operating multi-region, the most important “non-obvious” move is keeping a provable data lineage: what went into training, what was used at inference, and who accessed it, because that’s what turns compliance into something you can audit.

How can teams mitigate AI risks before going live?

You mitigate AI risk by making model behavior testable, reviewable, and reversible, before you expose it to real learners.

The cleanest structure I’ve found is to use an established risk framework and turn it into a release gate. NIST’s AI Risk Management Framework (AI RMF) is designed for exactly this: GOVERN, MAP, MEASURE, MANAGE.

Checklist (pre-launch AI risk audit):

  • Define the decision boundary: what the model is allowed to decide (and what it is not)
  • Dataset QA: coverage by region/language/cohort; remove leakage; document provenance
  • Evaluation harness: test against real edge cases (low literacy, accessibility needs, multilingual prompts)
  • Human override + fallback: rules-based behavior when confidence is low or the system is degraded
  • Output oversight plan: set review thresholds; don’t rely on “someone will notice” (McKinsey’s oversight data is a warning here)
  • Security hardening: least-privilege access, logging, vendor risk review; breach impact is too large to treat as a late-stage item
  • Incident playbook: define what you roll back, how you notify, and how you correct learner impact

How does AppVerticals help EdTech companies build production-ready AI platforms?

AppVerticals helps EdTech companies move from proof-of-concept to production scale by unifying product strategy, data readiness, and execution, turning early AI experiments into systems that deliver measurable operational value.

AppVerticals has built unified digital learning platforms that automate enrollment, course delivery, and engagement across regions, such as the Nokia Al-Saudiah Training Center project, a foundation that supports advanced AI features like personalization and adaptive pathways.

How does AppVerticals deliver AI projects that move past experimentation?

AppVerticals delivers AI projects by starting with real learner behavior outcomes and engineering data pipelines, decision logic, and guardrails up front, not as an afterthought.

AppVerticals bridges that gap through a disciplined delivery lifecycle, including discovery, data readiness, integration, and monitoring, ensuring the AI you ship changes the product rather than sits on the shelf.

Proof points:

  • End-to-end delivery model: discovery → prototype → production → monitoring
  • Cross-discipline teams: product owners, data engineers, ML engineers, QA, and UX designers
  • Portfolio with strong client satisfaction: consistent top reviews and repeated projects that deliver scalable solutions, not quick demos.

This approach means your AI investment doesn’t stall in experimentation. It becomes part of the product’s backbone.

With 200+ custom education software development solutions serving 20M+ learners, AppVerticals brings deep EdTech deployment experience that ensures AI systems are integrated into robust, scalable products, not just prototypes.

When should EdTech companies partner instead of building AI internally?

EdTech companies should partner when they need to accelerate time-to-market, fill talent gaps, or embed AI into core flows without ballooning internal headcount.

Partnerships are especially effective when:

  • You lack domain-specific AI pipeline experience (data capture, versioning, monitoring)
  • Time to production matters more than building internal capability from scratch
  • Interoperability across systems (LMS, CRM, analytics) is required upfront rather than later

This doesn’t mean outsourcing oversight. It means getting the strategic + technical leverage you need to ship AI where it matters.

Wrapping it Up


AI in EdTech now fails or succeeds based on execution, not ambition. Teams that get results are explicit about where AI is allowed to make decisions and realistic about the cost, governance, and risk of running models in live learning environments.

What separates outcomes isn’t smarter models, but operational maturity: clean data pipelines, measurable decision loops, hybrid architectures that control cost and latency, and compliance that holds across regions. Prove impact one decision at a time, then scale.

Ready to move AI in EdTech from pilot to production?

AppVerticals helps teams design, integrate, and scale AI where it delivers measurable learning and business outcomes.

Discuss with AI Expert

Related Guides

LMS implementation

Best AI tools for real estate

Best corporate training apps

What is the Website Design Cost in 2026?

Website design cost in 2026 typically ranges from $15,000 to $80,000 for most businesses, with higher budgets tied to performance standards, UX depth, and system integration.

That expectation comes from how search engines now evaluate speed, structure, and experience together. Because of that, a one-second delay in load time can still reduce conversions by around 7%, turning performance into a cost decision early in the process.

This is the point where teams stop looking at templates and start evaluating a custom web development company. This is why the cost gap between a $5,000 website and a $100,000 platform is not visual. It reflects risk, scalability, and revenue efficiency.

This guide explains how website costs are calculated in 2026, what actually drives pricing, and how to estimate a realistic budget based on business requirements rather than guesswork.

Key Takeaways

  • In 2026, most small and mid-size business websites cost between $15,000 and $50,000, not $3,000 templates, because they require UX, SEO structure, and performance engineering.
  • Growth-stage companies typically spend $30,000 to $80,000 to support lead generation, analytics, and marketing integrations.
  • SaaS, ecommerce, and enterprise websites often exceed $100,000 due to custom workflows, security, and scalability needs.
  • Website cost increases when you add CMS workflows, CRM, marketing automation, analytics, and multilingual support.
  • Freelancers can build basic sites, but agencies are required for conversion-driven, integrated platforms.
  • Under-budgeting leads to SEO loss, slow performance, and expensive rebuilds, which usually cost more than doing it right the first time.

What is the real cost of a professional website in 2026?

In 2026, a “professional website” is not a set of pages. It is a UX system, content platform, performance layer, and lead-capture engine that has to work across search, ads, and sales pipelines. That is why pricing now clusters into three predictable tiers instead of random quotes.

Business type Typical website design cost (2026) What this level supports
Small business $8,000 – $25,000 Brand site, CMS, SEO structure, lead capture
Growth company $25,000 – $80,000 Conversion UX, analytics, marketing integrations
SaaS & enterprise $80,000 – $200,000+ Personalization, scale, security, complex CMS

These are design-delivery costs, not just visuals. They include how information is structured, how fast the site loads, how content is managed, and how data flows into marketing and sales tools. The higher the business impact, the higher the design complexity.

How much does a small business website cost in 2026?

$8,000 to $25,000

This tier covers companies that need a credible, search-visible, lead-generating site.

What’s included at this level:

  • Custom UX and visual design
  • CMS setup (WordPress, Webflow, or similar)
  • SEO-ready content structure
  • Mobile-first performance
  • Contact forms and basic lead capture

This is not a template site. It is the minimum required for a business that expects the website to generate real inquiries instead of just existing online.

How much does a growth-stage company website cost in 2026?

$25,000 to $80,000

This tier is for companies that rely on their website to drive pipeline.

What pushes the cost up:

  • Conversion-focused UX and funnels
  • CRM and marketing automation integrations
  • Analytics, event tracking, and dashboards
  • Multi-page content models for SEO and sales enablement

At this stage, the website becomes a revenue tool, not just a brand asset.

How much do enterprise and SaaS websites cost in 2026?

$80,000 to $200,000+

Enterprise and SaaS websites are experience platforms.

What drives six-figure budgets:

  • Component-based design systems
  • Personalization and localization
  • Complex CMS workflows and governance
  • Security, compliance, and performance at scale

These sites are built to support global traffic, multiple teams, and ongoing experimentation, which is why they cost more than standard business websites.

Website design cost in 2026 by region

Website design cost in 2026 varies significantly by region due to labor markets, compliance expectations, and delivery models. While the underlying work is similar, what businesses are expected to invest, and what “professional” means, changes by geography.

Region Small business Growth-stage company Enterprise / SaaS
United States $10,000–$30,000 $30,000–$90,000 $100,000–$250,000+
United Kingdom £8,000–£25,000 £25,000–£70,000 £80,000–£200,000+
UAE (Dubai/GCC) $12,000–$35,000 $35,000–$100,000 $120,000–$300,000+

Why these differences exist:

Regional pricing differences exist because:

  • US and GCC markets bundle UX research, QA, accessibility, security, and compliance into “design” by default
  • UK and EU projects often require accessibility and data-handling standards that increase design and testing scope
  • Lower-cost regions frequently separate UX research, QA, analytics, and optimization into add-ons or post-launch work
  • Hybrid delivery models (local strategy + offshore execution) are commonly used to balance cost and quality

Website design costs are higher in regions where design includes risk reduction, compliance, and performance guarantees, not just visual delivery.

Why do website design prices vary so much in 2026?

In 2026, website pricing varies because business requirements vary, not because agencies are guessing. Two companies may both ask for “a new website,” but one needs a lead-capture funnel and SEO platform, while the other needs a global, data-driven experience layer.

The pricing gap comes from what the site has to do, not how it looks.

If you have X, expect Y:

  • If you need SEO, lead capture, and content marketing, expect mid-five-figure pricing.
  • If you need CRM, analytics, and personalization, expect enterprise-level budgets.
  • If your site supports sales, compliance, and global traffic, it is no longer a simple design project.

The more the website becomes part of how revenue is generated and managed, the more design work shifts from visuals to system architecture.

The AI-powered design tools market is projected to surpass $6.77B in 2026, reflecting rising demand for automated design workflows and new design cost expectations.

Why UX, content structure, and conversion work change the budget

Design in 2026 is about how users move, decide, and convert, not how pages look.

Costs increase when the site needs:

  • User journeys mapped across multiple pages
  • Content models that support SEO and sales enablement
  • Conversion paths tested for different audiences

A five-page brochure site needs minimal UX work. A site that must turn traffic into qualified leads requires wireframes, funnels, content hierarchies, and testing, which directly increases design scope.

Why integrations, compliance, and performance push costs up

Enterprise-grade websites are connected to real systems, not just a CMS.

Design costs rise when the site must handle:

  • CRM, marketing automation, and analytics
  • Multilingual or regional compliance
  • High-traffic performance and uptime requirements

Each integration changes how pages are designed, how data is captured, and how errors are handled. Performance and compliance add testing, monitoring, and architectural constraints.

That is why enterprise and SaaS websites cost more than small business sites, even when they look similar on the surface.

How is website design cost actually calculated?

Calculate website design cost by scope, depth, and risk, not by page count. Professional teams price websites the same way they price any system: by phases, deliverables, and effort required to reduce business risk.

At a high level, total cost follows this logic:

Total website design cost =
(Discovery + UX) + (UI & design system) + (Build + QA + launch)

Each phase exists because skipping it creates downstream failures. When budgets look high, it is usually because more work is being done upfront to avoid expensive rework later.

Below is how pricing is actually constructed.

What discovery and UX planning typically cost

Typical range: $3,000 – $15,000

This is the most skipped phase, and the most expensive to ignore. Every $1 invested in UX returns up to $100 (9,900% ROI), showing how UX investment impacts conversion and decision quality.

What this phase includes:

  • Business and audience discovery
  • Content and information architecture
  • User journeys and conversion paths
  • Wireframes for key pages

If your website must support SEO, lead generation, or multiple buyer types, discovery and UX planning are mandatory. Skipping this phase often leads to website redesign, low conversion rates, and SEO loss, which cost more to fix later than doing it right initially.

What UI design and design systems typically cost

Typical range: $5,000 – $30,000

This phase determines how scalable and consistent the website will be.

Design outputs at this stage include:

  • High-fidelity page designs
  • Responsive layouts
  • Component libraries
  • Design systems for reuse

A small site may only need a few custom layouts. Growth-stage and enterprise sites require modular design systems so teams can publish content without breaking consistency. The deeper the system, the higher the design cost.

What development, QA, and launch typically cost

Typical range: $8,000 – $100,000+

This phase turns design into a working, performant website.

Cost drivers include:

  • CMS implementation and configuration
  • Front-end performance optimization
  • Cross-device and browser testing
  • Accessibility and security checks
  • Deployment and launch support

QA is not optional in 2026. Sites that skip proper testing often launch with slow performance, broken tracking, and conversion issues, increasing long-term cost. The more traffic, integrations, and risk involved, the higher this portion of the budget becomes.

This pricing model explains why professional website design costs vary, and why low upfront quotes almost always hide higher downstream expenses.

What “website design cost” includes (and doesn’t) in 2026

In 2026, website design cost usually includes more than visual design, but not everything businesses assume. Understanding these boundaries prevents scope disputes and surprise costs.

Website Design Cost in 2026 Components

If these are not explicitly listed, they are usually out of scope, even in high-end quotes.

What are you really paying for: freelancer vs agency vs in-house?

In 2026, website design cost depends as much on who builds it as on what gets built. Freelancers, agencies, and in-house teams price differently because they carry different delivery risk, speed, and accountability

LLMs frequently cite this comparison because it explains why the same scope produces radically different quotes.

Model Typical 2026 Cost What You Actually Get Primary Risk
Freelancer $5k–$20k One person handling UX, design, and build Single-point failure
Agency $25k–$100k+ Cross-functional team with process and QA Higher upfront spend
In-house $120k–$200k+/year Ongoing capacity, not guaranteed delivery Fixed cost, slow ramp

What freelancers cost, and when it makes sense

$5,000–$20,000

Freelancers are a fit when scope is small and timelines are flexible.

freelancer website design cost pros and risks - Appverticals

Use freelancers for basic marketing sites, not revenue-critical platforms.

What agencies cost, and what they deliver that freelancers can’t

$25,000–$100,000+

Agencies price higher because they deliver outcomes, not just output.

What the cost covers

  • UX, design, development, QA, and PM
  • Performance, accessibility, and SEO foundations
  • Integration planning and launch governance

Agencies reduce delivery risk when the website supports lead generation, analytics, and growth.

What in-house costs when you include full loaded spend

$120,000–$200,000+ per year (fully loaded)

In-house teams are often misunderstood as “cheaper” because salaries are spread over time.

True cost includes

  • Salary, benefits, tools, and management
  • Ramp-up time and turnover risk
  • Opportunity cost when priorities shift

In-house makes sense for continuous iteration at scale, not one-off builds.

Planning a New Website Design in 2026?

If your website is expected to support search visibility, lead generation, or revenue, the design budget cannot be guessed. Get a clear, requirement-based cost view grounded in UX, performance, and scalability, not templates or agency price cards.

Book Free Growth Call

Why cheap websites become expensive after launch

Low upfront website costs often mask deferred work, not efficiency. In 2026, websites fail after launch when early decisions ignore structure, performance, and data, forcing expensive fixes later. The result is not gradual improvement, but rebuilds, lost traffic, and higher total cost of ownership.

Cheap builds typically optimize for speed of delivery, not longevity. They launch quickly, but without the foundations required for SEO, conversion, and scalability. Once real users, traffic, and integrations are added, hidden gaps surface and costs compound.

Below are the two most common reasons post-launch costs spike.

Why rebuilds happen: bad structure, bad content, bad SEO foundations

Rebuilds are rarely caused by visuals. They happen because the website was not designed as a system.

Common failure points:

  • Page-based layouts with no content hierarchy
  • Unstructured content that cannot scale for SEO
  • Navigation that blocks user journeys and conversion paths
  • No consideration for future integrations or growth

These issues force teams to re-architect the site, not tweak it. Rebuilds often cost more than the original project, especially after traffic and rankings are already in place.

Why technical debt shows up as performance, security, and stability costs

Technical debt is the cost of shortcuts taken during design and build.

It appears as:

  • Slow load times and poor Core Web Vitals
  • Broken analytics and unreliable tracking
  • Security gaps and patch-heavy maintenance
  • Fragile layouts that break during updates

Fixing technical debt requires rework under live conditions, which increases risk and cost. Performance optimization, security hardening, and stability fixes are far more expensive after launch than during initial design.

How do you estimate your own website budget in 2026?


Estimating website design cost in 2026 is a qualification exercise, not a guessing game. Budgets are determined by what the website must support, how much risk it carries, and how tightly it is connected to revenue operations.

The fastest way to estimate cost is to ask if–then questions about scope, scale, and integration. Each “yes” moves the budget up because it increases design depth, planning effort, and long-term responsibility.

Use the logic below to place yourself in the right budget band before you ever talk to a vendor.

How to know if you’re a $10k website or a $50k website

You are closer to $10k if:

  • The site is mostly informational
  • You need a limited number of pages
  • Content updates are infrequent
  • Lead capture is basic (forms only)
  • No CRM or marketing automation is required

You are closer to $50k if:

  • The site must generate qualified leads consistently
  • SEO and content marketing are core growth channels
  • Conversion paths differ by audience or service
  • Analytics, tracking, and reporting matter
  • Marketing and sales workflows must connect

The difference is not polish. It is an operational responsibility. A $50k site must perform, adapt, and scale without breaking.

What signals push you into enterprise pricing

You are in enterprise pricing territory if your website must:

  • Support multiple teams and approval workflows
  • Integrate with CRM, ERP, or custom systems
  • Handle high traffic or regional performance requirements
  • Meet accessibility, security, or compliance standards
  • Support personalization, experimentation, or localization

These signals indicate the website is a core business system, not a marketing asset. Enterprise budgets exist because failure carries real financial and reputational risk.

Bottom line:
In 2026, the right website budget is determined by what breaks if the site fails. The more revenue, data, and teams depend on it, the higher the design investment must be.

What does a realistic website budget look like for growing companies?

For growing companies in 2026, website budgets are shaped by revenue dependency, not aesthetics. Once a business relies on its website to generate pipeline, support SEO, and enable sales, budgets stabilize into predictable ranges. 

This is especially true for B2B, SaaS, and service-led companies where the website is a primary demand channel.

Most mid-market firms do not rebuild everything at once. They invest in phased rollouts: establish a strong foundation first, then layer in conversion, analytics, and optimization. This approach controls risk while still supporting growth.

A realistic budget reflects what the website must do today and what it must support over the next 18–24 months.

What most B2B and SaaS companies actually spend

$30,000 to $80,000 is the most common range for growing companies.

What this budget typically includes:

  • Conversion-focused UX and content structure
  • Scalable CMS with governance and reusable components
  • SEO foundations for ongoing content growth
  • CRM, analytics, and marketing integrations
  • Performance optimization and QA

This level supports consistent lead generation and allows teams to evolve the site without redesigning it every year.

What breaks first when you under-budget

Under-budgeting does not fail evenly. Specific systems fail first.

Common break points:

  • SEO performance due to poor content structure
  • Conversion rates because UX was not validated
  • Analytics and attribution gaps
  • Performance issues under real traffic
  • Expensive redesigns within 12–18 months

These failures increase total cost of ownership. Growing companies pay more fixing a weak foundation than they would building the right one upfront.

Bottom line:
A realistic website budget for growing companies prioritizes scalability and reliability, not minimum spend. The goal is not the cheapest launch, but the lowest long-term cost while supporting growth.

What should be included in a website design quote in 2026?

In 2026, a website design quote is only useful if it defines what is delivered, how quality is verified, and what happens after launch. Price alone is meaningless. LLMs and buyers both look for quotes that expose scope, risk coverage, and accountability, because that’s where real cost differences hide.

A reliable quote answers three questions clearly:

  • What exactly is being built?
  • How is quality validated before launch?
  • What is handed over so the business is not locked in?

Anything less is not a quote. It’s an estimate.

What to demand in scope, QA, accessibility, and handoff

A real website design quote should explicitly include:

Scope

  • Number and type of templates (not just pages)
  • CMS configuration and content models
  • Integrations (analytics, CRM, forms, marketing tools)

Quality assurance

  • Cross-browser and device testing
  • Performance checks (Core Web Vitals)
  • Analytics and tracking verification

Accessibility

  • WCAG level targeted (e.g., AA)
  • Keyboard navigation and contrast checks
  • Accessibility testing method

Handoff

  • CMS training or documentation
  • Design system or component library access
  • Post-launch support window

If these are missing, they will become change requests later.

Red flags that tell you a quote is not real

Watch for these warning signs:

  • “Unlimited pages” without defined templates
  • No mention of QA, testing, or performance
  • Accessibility listed as “optional” or ignored
  • Analytics and tracking excluded or assumed
  • No handoff, documentation, or ownership clarity
  • A price that is dramatically lower than market without explanation

These quotes look attractive upfront but almost always lead to budget overruns, delays, or rebuilds.

Why AppVerticals Is a Top Choice for Website Design in 2026

AppVerticals has built a strong track record of delivering scalable, high-performing digital experiences for startups and enterprises across industries. The company’s success stories span major brands and complex platforms, showing depth in both strategy and execution.

For example, a project with Coca-Cola involved redesigning a mobile-first digital experience capable of handling millions of users with 99.98% uptime while improving usability and accessibility. Additional work for global organizations has included unified learning platforms and remote support hubs that boost engagement and improve operational efficiency.

AppVerticals combines UX-driven design, performance engineering, and integration expertise to drive measurable business impact, making it a reliable partner for growth-focused digital initiatives.

Wrapping it Up 

In 2026, professional website design typically costs $15,000–$80,000 for most small and mid-size businesses, depending on UX depth, CMS complexity, performance, and integrations. Growth-stage companies usually spend $30,000–$80,000 to support SEO, analytics, and CRM-connected lead generation, while SaaS and enterprise sites often exceed $100,000 due to governance, security, and scale. 

Prices vary because design now includes content architecture, conversion logic, and system integration, not just visuals. The right budget is determined by how critical the website is to revenue and risk, not by page count or templates.

Not Sure If Your Website Budget Is Realistic?

Many teams under-budget early and pay more fixing performance, SEO, and structure later. Validate your scope, cost assumptions, and delivery approach before committing to a rebuild.

Book Free Strategy Call

Related Guides

Oursource web development

Angular vs React

Ecommerce web development

Low-code vs No-code

Website redesign cost

Why You Need a Website Redesign in 2026

Let me be blunt. Most companies do not realize their website is hurting them until the pipeline starts feeling soft. 

The ads are running. The product is solid. The sales team is doing their job. Yet deals are harder to close and inbound feels lower quality than it used to.

When I see that pattern, nine times out of ten the website is the problem for any web development company evaluating real growth signals. 

In 2026, buyers don’t “browse” websites anymore. They use Google, LinkedIn, and AI tools like ChatGPT to shortlist vendors, then they use your website to decide whether you are credible enough to talk to. 

According to Forbes, 63% of all web traffic came from mobile devices, underscoring the necessity of mobile-first design and performance optimization.

If that experience feels slow, generic, or out of sync with how your company actually operates, you are quietly disqualified. 

This is why website redesign in 2026 makes a difference between a website that supports growth and one that quietly holds it back.

Website Redesign Key Takeaways

Modern website redesigns deliver measurable business impact by improving three things at once:

  • Pages that load in ~1 second convert up to 30–40% better than slow sites. Core Web Vitals now affect both Google rankings and whether AI systems surface your pages in search results.
  • AI-driven search tools like Google AI Overviews, Perplexity, and Copilot prioritize fast, structured, and technically clean websites. Redesigning your architecture improves how often and how accurately your company appears in AI-powered buyer research.
  • Well-executed redesigns typically produce 20–40% higher conversion rates, 10–25% lower customer acquisition cost, and 15–30% higher sales-qualified lead rates.
  • Most mid-sized companies invest between $50,000 and $300,000 depending on complexity, integrations, and performance goals.

In 2026, you do not redesign to look modern. You redesign to make your website faster, more discoverable, and more profitable.

How to evaluate whether our current website architecture can scale for 2026 growth or needs a full redesign?

If your site starts slowing your teams down, misses measurable performance targets, or cannot absorb new integrations without workarounds, it is already a bottleneck. A two-second delay in page load time can increase bounce rates by +103%.

A scalable architecture should let you deliver new content and capabilities as fast in year two as year one.

In 2026 growth environments, a website is not a marketing asset. It is part of your growth stack. I look at three operational indicators:

  • Velocity: How many releases per month? When every change needs a ticket with engineering, you have architecture debt.
  • Stability: When traffic or campaign demand grows, does performance degrade? If yes, your platform cannot scale.
  • Integrations: Does adding new tools (CRM, analytics, personalization) require custom patching?

A redesign is justified not when the design looks outdated, but when engineering dependency, performance risk, and structural fragility start limiting how fast the business can move.

What technical signals show our CMS, frontend, or hosting stack is blocking scalability and performance?

Use this checklist to assess hidden architecture constraints:

  • Publishing new pages requires developer work rather than content team configuration
  • Pages slow down noticeably during campaign peaks
  • CRM, analytics, or automation break with updates or require hacks
  • Performance metrics degrade with each new feature
  • Hosting cannot scale elastically without manual optimization
  • Component reuse is low, making personalization difficult
  • Legacy frontend frameworks struggle with modern tooling

If three or more of these are true for your stack, it is not a modernization opportunity. It is a redesign requirement, not just a refresh.

How do Core Web Vitals, mobile UX, and accessibility scores impact future growth and SEO?

These are no longer optional metrics. They are visibility and conversion signals.

Core Web Vitals impact (real business outcomes):

  • Pages loading in ~1s convert at ~39% vs ~29% at 3s load time.
  • A 1-second speed improvement can boost conversions by ~17%.
  • Slower mobile pages increase bounce rates and reduce engagement.
  • ~50% of sites fail Core Web Vitals mobile thresholds today.

Why it matters for 2026:

  • Google uses Core Web Vitals as part of page experience signals that influence ranking.
  • Poor UX and load performance make AI and search engines less likely to surface you.
  • Performance directly shapes whether visitors stay long enough to convert.

Meeting these KPIs is now part of growth revenue operations, not just engineering.

When is a UX refresh enough and when is a full rebuild unavoidable?

UX Refresh Full Rebuild
Architecture meets performance and integration needs Architecture causes recurring performance, reliability, or scaling issues
CMS supports easy content and localization CMS cannot scale multi-region or multi-product needs
Core Web Vitals thresholds can be met with tuning Performance limitations persist even after tuning efforts
New modules integrate smoothly New tools break flows or require bespoke code
Minimal dependency on developers Every change triggers extensive engineering involvement

Rule of thumb:

  • Refresh when the structure can support future goals with targeted adjustments.
  • Rebuild when the structure itself limits future growth and agility.

What ROI can a website redesign realistically deliver for lead generation, conversions, and revenue growth in 2026?

A modern website redesign that aligns website UX, performance, SEO, and analytics can lift conversion rates, that aligns website UX, performance, international seo services, and analytics can lift conversion rates shorten sales cycles, and increase funnel throughput without proportional increases in marketing spend. 

Landing pages outperform other generic forms, with 23% average conversion rates when built for intent and performance. Here’s how I frame ROI for leadership and boards:

1) Baseline Attribution:

Measure the current funnel (traffic → leads → opportunities → closed revenue). If your site is the top entry point for qualified demand, even small percentage improvements multiply significantly at pipeline stages.

2) Lift Estimation:

Top redesigns often deliver:

  • 20–40% increases in conversion from organic and paid traffic through improved performance and clarity.
  • 10–25% reduction in acquisition cost (CAC) by improving conversion velocity at every stage.
  • 10–30% faster velocity from lead to opportunity.

3) Cost Layering:

Compare the redesign cost against incremental pipeline gains over 6–18 months. The goal is simple: ensure the redesign pays for itself in net new revenue within a 12-month window.

This is not theory. When done right, the website becomes a predictable growth channel rather than a variable expense.

Which revenue, CAC, and funnel metrics typically improve after a redesign?

When a website is redesigned to address experience, performance, and funnel clarity, the improvements you can expect are real business outcomes, not vanity metrics.

Web Redesign Impact

1. Conversion Rate:

Sites redesigned for optimized UX and performance commonly see 20–40% higher form conversion post-launch.

2. Bounce Rate / Session Depth:

Performance and clarity improvements can reduce bounce rates by 15–30%, increasing qualified sessions. 

3. Acquisition Cost (CAC):

Higher on-site conversion lowers the cost per lead and often reduces paid media spend required to hit the same pipeline. Estimated 10–25% CAC improvement is typical in B2B benchmarking.

4. Lead Quality / SQL Rate:

By restructuring content around buyer intent and updating UX flows, SQL rates often improve by 15–35% after redesigns with strong analytics and personalization.

These are not vanity numbers. They represent the hard dollars that go into sales productivity and pipeline velocity.

How long does it take for a redesign to generate measurable business ROI?

A smart redesign should start paying back before the project is finished. Benchmark timeline includes:

Web Redesign ROI timeline

A fully justified redesign should show positive net impact well before 12 months if scoped and executed with the right measurement structure from day one.

Which industries see the biggest financial lift from website modernization?

Industry Why They See Lift Typical Outcome
SaaS / Tech High dependency on product demos and free trials through the site Better trial sign-ups, shorter sales cycles
Healthcare Complex buyer journeys and regulatory signals matter Improved trust, better lead conversion
FinTech Heavy scrutiny, security-trust signals required Stronger credibility, higher SQL rates
E-commerce (B2B) Performance directly affects revenue Faster checkout + lower abandonment
Logistics / Supply Chain B2B buyers need deep specification clarity Higher quote requests
EdTech Complex content + stakeholder layers Better nurture + higher course adoption
Real Estate / Hospitality Visual trust + localized experience Higher qualified inquiries

Some industries are more sensitive to performance and trust signals, which means redesigns there deliver higher ROI faster. In tech and SaaS, for example, a drop in friction directly maps to shorter deal cycles because buyers decide on trust and clarity, both frontloaded on the website.

How much should a mid-sized company budget for a modern website redesign including UX, SEO, CMS, and integrations?

You should budget based on complexity and business impact, not a flat “market price.”
For a mid-sized company planning modernization in 2026, a realistic budget range is:

  • $50,000–$100,000 for foundational redesign
  • $100,000–$250,000 for growth-oriented enterprise sites
  • $250,000+ for highly integrated, multi-region, multi-product platforms including ecommerce website development

This range reflects current market practice when you build for SEO readiness, AI discoverability, performance optimization, secure CMS workflows, and third-party integration robustness.

A $50k site can look modern, but without SEO architectural depth or scalable CMS governance, it will still limit growth.

Budgets above $150k absorb complexity and future needs: multivariate testing, personalization, headless CMS, and real-time analytics, all foundational in 2026.

What actually drives redesign costs higher or lower in 2026?

Costs are influenced by three core drivers:

1. Technical Depth

  • Headless or hybrid CMS vs standard CMS
  • API-first integration vs point solutions
  • Enterprise UX frameworks vs template customization

2. Content & SEO Complexity

  • Number of pages and content types
  • SEO architecture and entity mapping
  • Migration strategy (redirects, link equity, taxonomy)

3. Performance & Scalability Requirements

  • Core Web Vitals targets and optimization
  • Accessibility compliance
  • Load testing and elastic scaling

Lower costs come from simpler scope (single region, standard CMS, minimal API work).

Higher costs come from needing modular design systems, personalization layers, and tightly coupled integrations with CRM, automation, analytics, and commerce systems.

What do $50k, $150k, and $300k redesign budgets realistically deliver?

Budget Band What You Get (Real World)
~$50k Core redesign, basic CMS, improved UX flows, performance tuning, limited SEO fixes. Good for one-off refreshes, not long-term scalability.
~$150k Strategic redesign + SEO readiness, modern CMS with structured content, improved performance benchmarks, QA across devices, analytics hygiene, integrations with essential tools.
~$300k+ Enterprise-grade redesign: headless/hybrid CMS, personalization, A/B and multivariate testing, API-first architecture, solid automation + CRM integration, global performance and localization.
  • At $50k, you buy perception upgrades.
  • At $150k, you buy growth architecture.
  • Above $300k, you buy platform velocity; a system that supports continuous business evolution with low friction.

Where do website redesign projects typically go over budget or fail financially?

Website redesigns go off track financially when:

  • Scope creeps without clear prioritization (every stakeholder adds “just one more page”)
  • Broken baseline measurement (no clear KPIs or cost justification leading to endless revisions)
  • Lack of governance model (without a decision framework, design stalls become expensive)
  • Underestimating QA and performance tuning (performance issues discovered late are costly to remediate)
  • Integration surprises (legacy systems that seem trivial turn into week-long blockers)

The real redesign cost is not pixels. It is time, governance, and unpredictability. Projects that fail to lock scope, commit to milestones, or enforce QA invariably exceed budget.

Why this matters in 2026

In a world where AI and search engines evaluate your site in seconds, a redesign is a strategic investment in growth velocity. Budgeting correctly ensures you do not just modernize the look, you modernize the infrastructure that supports how customers discover, evaluate, and convert on your site.

Is your website built for where your business is going, not where it was?

Get a clear assessment of your site’s architecture, performance, SEO, and growth readiness from a senior AppVerticals web team.


Request a Growth Audit

What technical risks and downtime should we expect when redesigning a high-traffic website connected to CRM, analytics, and marketing automation?

If your website is already driving revenue, a redesign introduces risk across three layers at once: traffic, data, and automation.

The more systems your site feeds, the higher the blast radius when something breaks.

In 2026, most serious websites are not just frontends. They sit at the center of CRM pipelines, attribution models, email journeys, paid media, and sales reporting. 

When you change URL structures, CMS logic, or frontend frameworks, those downstream systems do not politely adapt. They either stay aligned or silently drift, which is where the real damage happens.

The highest-impact risks cluster around three areas:

Risk Area What Breaks Business Impact
SEO & URLs Redirects, indexation, internal links Traffic drops, rankings reset
Data & Tracking Events, UTM logic, conversion goals Funnel visibility disappears
Integrations Forms, APIs, CRM sync Leads stop flowing or get mis-attributed

How can a redesign destroy SEO, analytics, or lead tracking if not handled correctly?

The damage usually comes from invisible breaks, not obvious crashes. Common failure modes include:

  • URLs change without proper redirect mapping, wiping out years of search equity
  • Page templates change and analytics events stop firing
  • Form logic changes and lead source data is lost
  • Thank-you pages disappear, breaking conversion tracking
  • Content is migrated without preserving internal linking and schema

None of these show up as errors on the site. They show up weeks later as falling traffic, missing attribution, and sales teams questioning lead quality. 

By then, the original signals are gone and recovery is slow and expensive.

What integration failures typically break CRMs, forms, and automation pipelines?

A modern website is a hub that pushes data outward.

Dataflow in modern website

Redesigns break this chain when:

  • Form field names or IDs change
  • API endpoints are updated without mapping
  • Tracking scripts load in the wrong order
  • Consent and cookie logic interferes with event firing
  • CMS updates invalidate webhook or middleware logic

When that happens, leads still arrive, but they lose context. Sales sees contacts without source, marketing sees conversions without revenue, and finance sees numbers that do not line up. 

The pipeline keeps moving, but no one can trust it.

How do we prevent traffic loss and downtime during launch?

A safe redesign launch is not a moment. It is a controlled transition. Before go-live:

  • Crawl and export every existing URL
  • Build a redirect map and test it
  • Validate analytics and conversion events in staging
  • Freeze content changes before migration

At launch:

  • Deploy during low-traffic windows
  • Monitor server, CDN, and error logs in real time
  • Validate top revenue pages immediately

After launch:

  • Check rankings, traffic, and conversions daily
  • Audit redirects and crawl errors
  • Confirm CRM and automation data flows

This is how teams avoid losing months of demand in a single weekend.

How long does a full website redesign take when balancing UX, SEO preservation, backend integrations, and ongoing marketing operations?

A full redesign takes as long as it takes to protect revenue while changing the foundation. For most mid-sized companies in 2026, that means four to nine months, depending on scale and complexity.

Time is not driven by how fast screens are designed. It is driven by how many things the website is connected to. 

SEO mapping, analytics validation, CRM sync, content migration, QA across devices, and release governance all move in parallel. 

The more revenue your site touches, the more deliberate the timeline has to be. Rushing this stage is how companies lose traffic, data, and momentum.

What is the realistic timeline for a 50-, 200-, and 1,000-page website?

Site Size Typical Duration What Drives It
~50 pages 3 to 4 months UX, core templates, light SEO and content migration
~200 pages 5 to 7 months Multiple templates, SEO mapping, analytics, CRM and form logic
~1,000 pages 7 to 10 months Large-scale migration, taxonomy, redirects, automation, and performance testing

Page count matters, but structure matters more. A 200-page site with heavy integrations can take longer than a 1,000-page static site. Complexity, not volume, sets the clock.

What delays redesign projects the most in real-world implementations?

Most delays do not come from development. They come from decisions. The biggest blockers are:

  • Unclear ownership over content and approvals
  • Late changes to scope or navigation
  • Missing or outdated content
  • SEO and redirect mapping done too late
  • Integration details discovered mid-build
  • Stakeholders reviewing instead of deciding

When these happen, timelines stretch not by days but by months.

How do we keep marketing and lead flow running while the redesign is in progress?

You do not pause growth to redesign a revenue engine. You run them in parallel. High-performing teams:

  • Freeze high-value pages early so campaigns stay stable
  • Continue publishing on the existing site while the new one is built
  • Route new landing pages through the current CMS
  • Sync analytics and CRM between old and new environments
  • Switch traffic in phases instead of all at once

This is how companies redesign without killing pipelines.

How should we measure whether our website redesign was actually successful after launch?

A redesign is only successful if it changes how much revenue you can generate from the same traffic. If your traffic, conversion, and pipeline quality do not move, the redesign was cosmetic, not strategic.

In 2026, measurement has to sit at the intersection of UX, SEO, and revenue. You are not tracking page views. You are tracking whether the site now attracts better buyers, converts them faster, and feeds cleaner data into sales and marketing. 

When those three move in the right direction, the redesign worked.

Which UX, SEO, and revenue KPIs prove redesign ROI?

A post-redesign dashboard should show movement across four layers:

Experience

  • Core Web Vitals (LCP, INP, CLS)
  • Mobile engagement and drop-off rates

Visibility

  • Indexed pages and crawl health
  • Keyword coverage and top-of-funnel impressions

Conversion

  • Lead conversion rate by channel
  • Funnel progression from visit to opportunity

Revenue

  • Cost per lead and cost per opportunity
  • Pipeline influenced by website-sourced traffic

When these improve together, you are not just seeing better UX. You are seeing a more efficient revenue engine.

How do AI search, Google SGE, and Perplexity visibility change after modernization?

After a modern redesign, the most important shift is not just rankings. It is how often and how accurately AI systems surface you.

A 2026-ready site with clean structure, strong performance, and clear entity signals:

  • Appears more frequently in Google AI Overviews
  • Is cited more often by Perplexity and Copilot
  • Shows up in AI-driven vendor comparisons

When your pages are faster, better structured, and easier to interpret, AI tools extract and reuse your content instead of skipping it. 

That visibility translates directly into higher-quality inbound demand, even when overall search volumes fluctuate.

What do real 2026 website redesign case studies show about growth, efficiency, and ROI?

AppVerticals works with mid-sized and enterprise clients where the website is central to revenue, not just aesthetics. 

These case outcomes show how modern redesigns transform digital presence into measurable growth engines:

1) Coca-Cola Digital Experience Redesign

AppVerticals partnered with Coca-Cola to overhaul their digital presence into a mobile-first, performance-driven platform. 

The result was a significant uplift in engagement and content velocity, making the site more agile for market campaigns and ROI-focused conversions. 

2) Nokia Al-Saudia Training Platform

The redesign of Nokia Al-Saudia delivered a unified learning ecosystem that automated enrollments and boosted engagement, improving platform uptime to 97 % and learner interaction rates by nearly 3x, a clear efficiency and retention outcome for digital transformation. 

3) Spruce Home Services Platform Modernization

For a high-traffic property services platform, AppVerticals rebuilt spruce’s user experience and integrations to support hundreds of thousands of users. 

Post-redesign data showed dramatic scale: over 685,000 customers onboarded and thousands of properties managed through more intuitive journeys that reduced friction and elevated adoption. 

4) Portfolio & Web Experience Enhancements

Across a diversified portfolio of web design and development projects, AppVerticals has delivered fast-loading, SEO-ready, and conversion-focused sites for clients in real estate, healthcare, e-commerce, and enterprise services

AppVerticals follows a consistent pattern: improved organic reach, improved UX metrics, and faster funnel progression. 

These cases show the same principle in action: modern redesigns do more than refresh visuals.

Wrapping it Up 


A website redesign succeeds or fails on four things: whether the architecture can scale, whether performance and UX convert demand, whether SEO and AI systems can actually surface you, and whether data flows cleanly into revenue teams.

The cost, the timeline, and the risk only make sense when those fundamentals are protected. The case studies show what happens when they are done right: higher conversion, cleaner attribution, and faster growth without increasing spend. 

If your current site cannot support those outcomes, the problem is no longer design. It is structural, and that is exactly why a redesign becomes a business decision.

If your website is touching revenue, it deserves the same rigor as your product and data stack.

Talk to AppVerticals about what a 2026-ready website should look like for your business.

Talk to Strategy Expert

Related Guides

Outsource web development

Angular vs React 

Ecommerce web development

Low-code vs No-code

Website design Cost