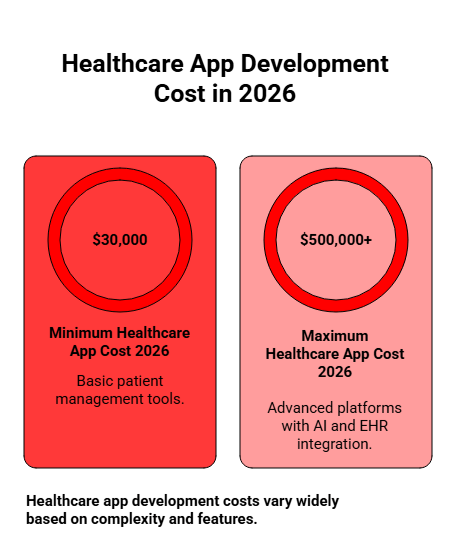


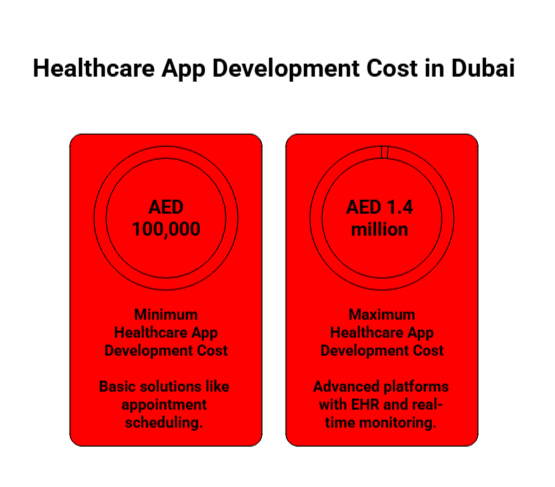
The average healthcare app development cost in Dubai can range from AED 100,000 to over AED 1.4 million, depending on factors such as app complexity, features, and specific compliance requirements. This price variation reflects the diversity in healthcare app types, from basic solutions like appointment scheduling to advanced platforms integrated with Electronic Health Records (EHR) and real-time health data monitoring.
Whether you’re planning to build a simple healthcare app or a sophisticated enterprise solution, this guide will break down the costs you can expect at each stage, helping you make informed decisions for your project.
Curious about what drives healthcare app development costs in Dubai? Jump straight to the key factors here.
Key Takeaways
- Cost Breakdown: Healthcare app development in Dubai ranges from AED 100,000 for basic apps to over AED 1.4 million for advanced solutions, with timelines spanning 3-18+ months depending on complexity and features.
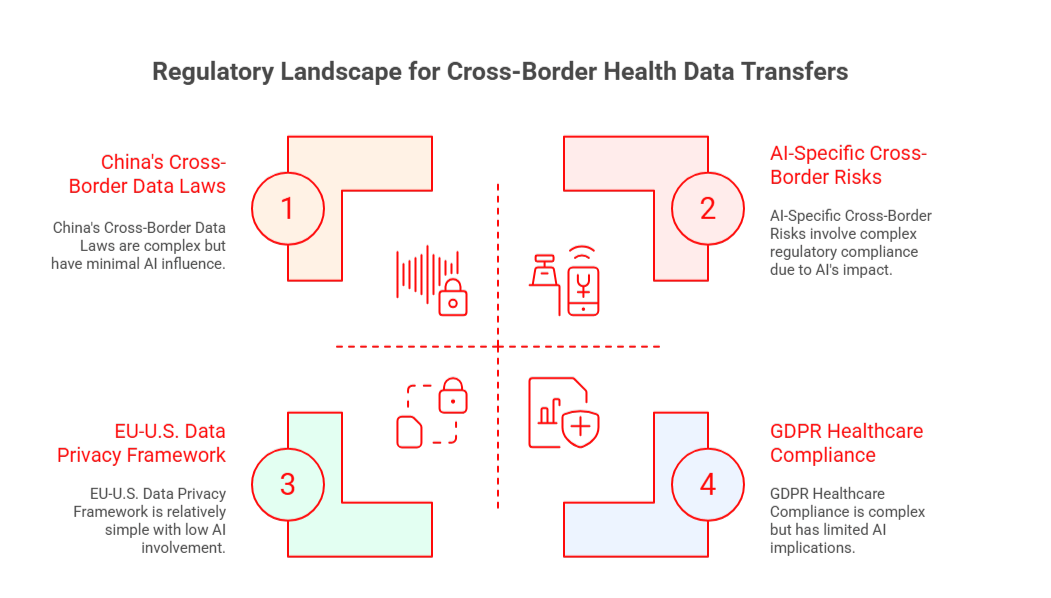
- Compliance Costs: Compliance with regulations like DHA, HIPAA, and GDPR is critical, adding 20-40% to development costs, but ensures market access and data security.
- Cross-Platform Development: Cross-platform development can reduce costs by 30-40%, making it an appealing choice for less complex apps, while native apps remain ideal for feature-rich, specialized solutions.
- Experienced Teams: Experienced development teams, especially those familiar with healthcare regulations, can lower long-term costs by speeding up development and minimizing errors.
- Local vs. Offshore Teams: Local vs. offshore development teams offer different pricing models, with Dubai-based teams providing ease of collaboration but at higher hourly rates.
How Much Does Healthcare App Development Cost In Dubai?
Understanding the cost of healthcare app development in Dubai is crucial for making informed decisions. The cost depends on various factors such as app complexity, team location, and the features you require. Here’s a breakdown of typical costs based on app complexity.
Average Cost Breakdown for Healthcare Apps in Dubai (by Complexity)
Below is a cost breakdown based on the complexity of healthcare apps. The prices vary depending on the features, technology, and timeline needed for each project.
| App Type | Cost Range | Timeline |
|---|---|---|
| Basic Healthcare App | AED 100,000 – AED 280,000 | 3–6 months |
| Mid-Tier Healthcare App | AED 280,000 – AED 550,000 | 6–12 months |
| Advanced Healthcare App | AED 550,000 – AED 1,470,000+ | 12–18+ months |
Cost Breakdown for Healthcare App Development in the GCC Region
When considering expanding your healthcare app development from Dubai to other GCC regions, it’s essential to understand the estimated costs for building apps in different countries. The costs can vary based on the market conditions, infrastructure, and regulatory environment of each country.
As a leading mobile app development company in Dubai, we’ve put together a detailed comparison of the estimated costs for healthcare app development in Dubai, Saudi Arabia, Qatar, Bahrain, and Ajman.
| Country / Emirate | Estimated Cost (USD) | Estimated Cost (Local) | Development Timeline |
|---|---|---|---|
| Dubai (UAE) | $50,000 – $400,000+ | AED 183,000 – AED 1,468,000+ | 6 – 18 months |
| Saudi Arabia | $45,000 – $375,000+ | AED 165,000 – AED 1,380,000+ | 6 – 16 months |
| Qatar | $40,000 – $320,000 | AED 147,000 – AED 1,175,000 | 6 – 15 months |
| Bahrain | $35,000 – $280,000 | AED 128,000 – AED 1,030,000 | 5 – 14 months |
| Ajman (UAE) | $45,000 – $300,000 | AED 165,000 – AED 1,100,000 | 5 – 14 months |
Estimated Cost Breakdown In Local Currency
Healthcare app development cost in UAE: AED 183,000 – AED 1,468,000+
Healthcare app development cost in Saudi Arabia: SAR 168,000 – SAR 1,410,000+
Healthcare app development cost in Qatar: QAR 146,000 – QAR 1,170,000
Healthcare app development cost in Bahrain: BHD 13,200 – BHD 105,000
Healthcare app development cost in Ajman: AED 165,000 – AED 1,100,000
Regional Trends in UAE Healthcare App Development Costs
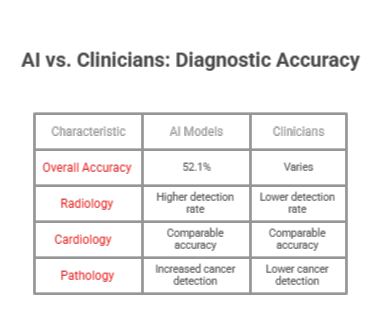
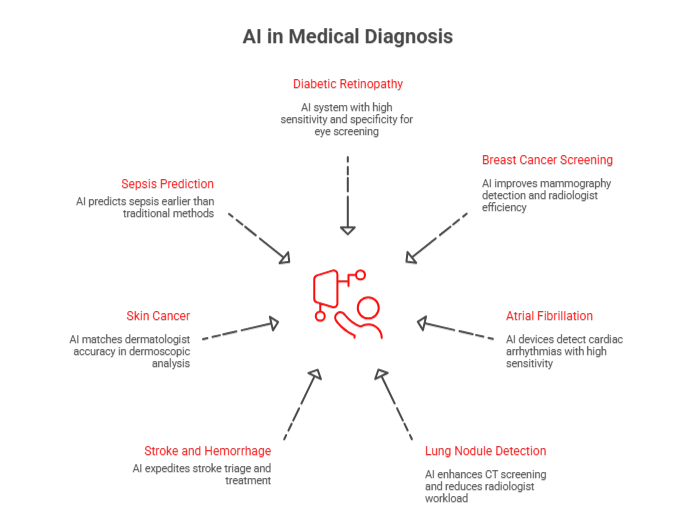
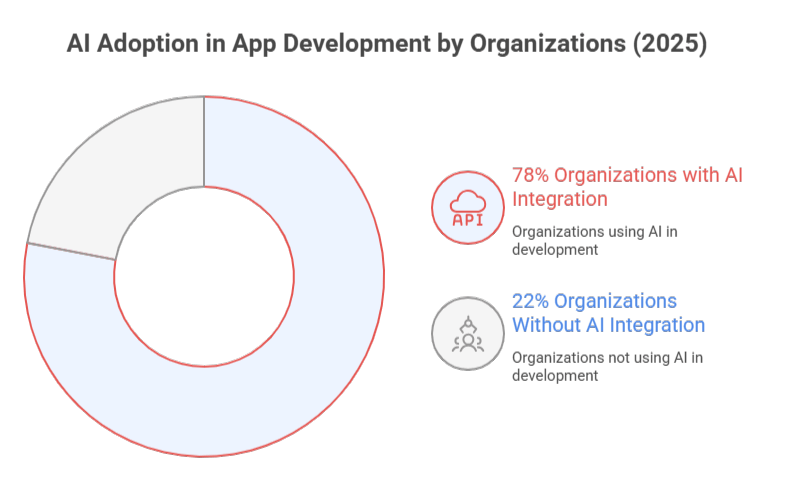
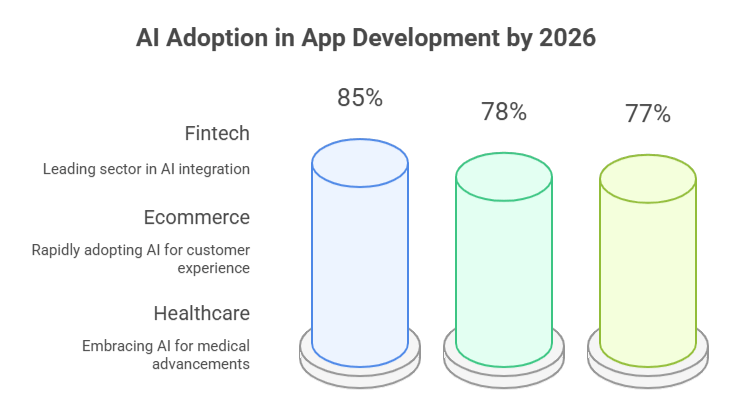
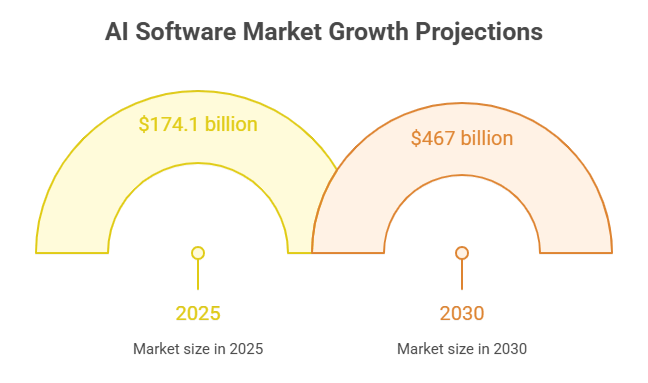
AI & Digital Health Adoption: The Middle East’s digital health market is set to grow rapidly, with AI transforming healthcare, particularly in the UAE and Saudi Arabia.
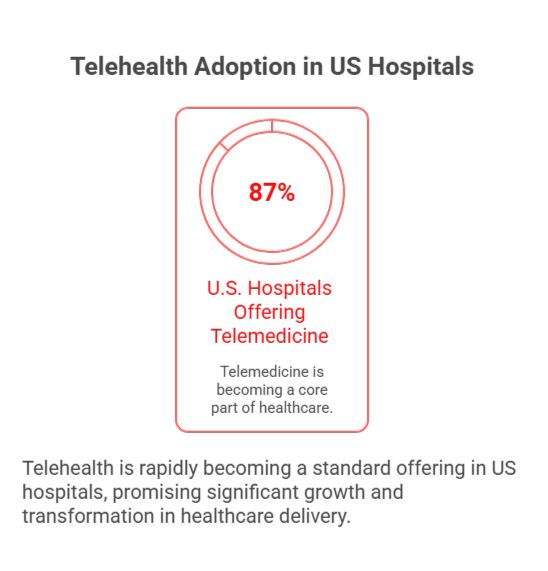
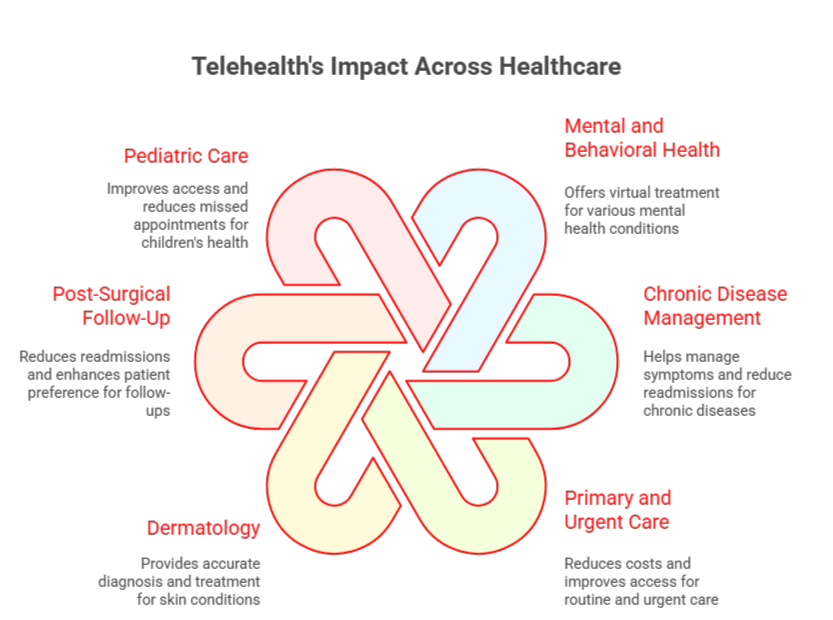
Telemedicine & Remote Care: Telemedicine adoption is expected to stabilize at 60-70% by 2025, fueling a growing demand for healthcare apps.
Vision 2030 Impact: Both the UAE and Saudi Arabia are making significant investments in healthcare infrastructure, which may reduce costs for approved projects.
Emerging Technologies: Blockchain, IoT, and AR/VR are driving costs up but are becoming more prevalent in the region, particularly in the UAE and Saudi Arabia.
The UAE leads in healthcare app development with its robust infrastructure and high costs, while countries like Egypt offer cost-effective alternatives without compromising on quality.
Ready to Build the Next Big Healthcare Mobile Solution In Dubai?
Partner with our talented team of engineers and get started with turning your vision into reality.
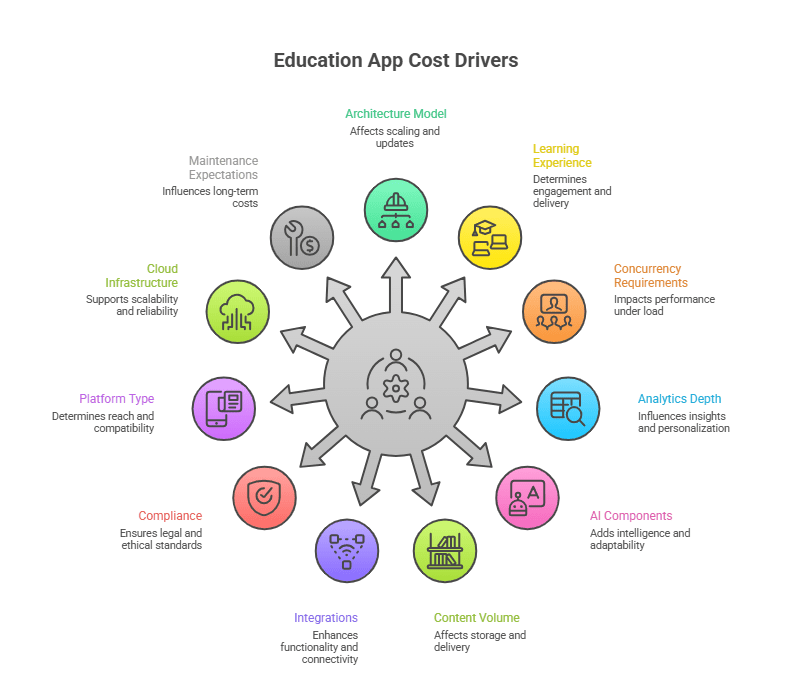
What Factors Impact Healthcare App Development Costs In Dubai?
The cost of healthcare app development in UAE is influenced by various factors, including app complexity, compliance requirements, platform choices, and design investments. Key elements such as these play a major role in determining the final mobile app development cost in Dubai.
Below are the main factors that shape your overall budget:
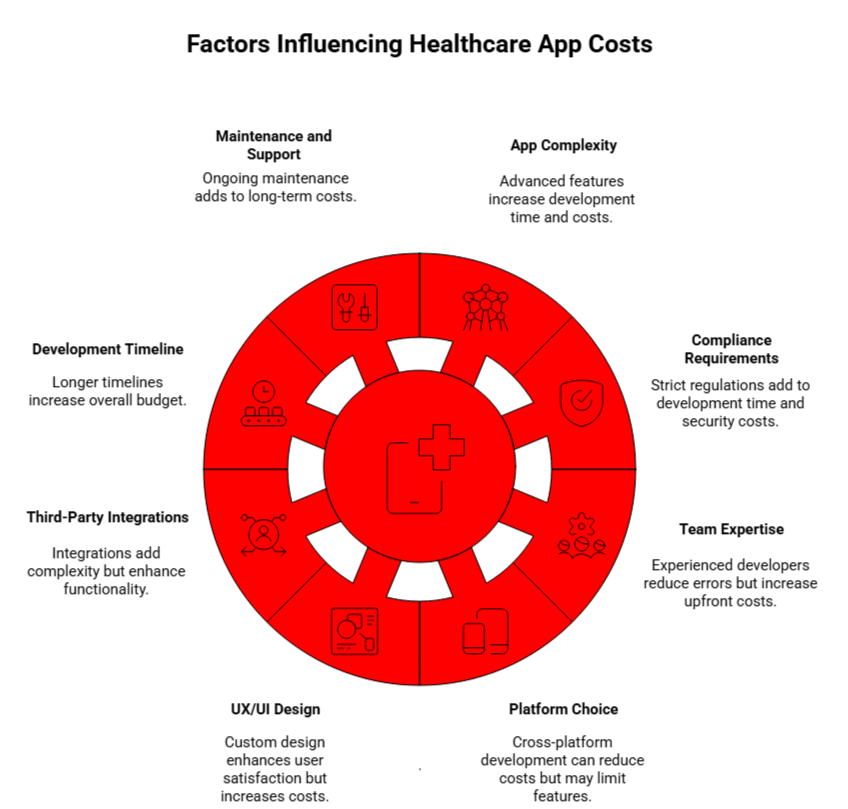
1. App Complexity
More advanced features like AI, IoT, or real-time monitoring require longer development time and higher costs. Simpler features like appointment scheduling are quicker and less expensive to develop.
2. Dubai Compliance and Security Requirements
Healthcare apps must meet strict regulatory standards such as DHA, HIPAA, and GDPR, which increase both development time and costs due to security and audit requirements.
3. Development Team Expertise
The experience level of your development team impacts the cost. Senior developers or specialists in healthcare regulations may cost more upfront, but reduce time and errors in the long run.
4. Platform Choice
Choosing between iOS, Android, or cross-platform affects cost. Cross-platform development can reduce costs but may not be suitable for highly complex apps requiring platform-specific features.
5. UX/UI Design
Custom UX/UI design tailored to healthcare needs increases costs but enhances user satisfaction and reduces rework, making it a valuable investment for long-term success.
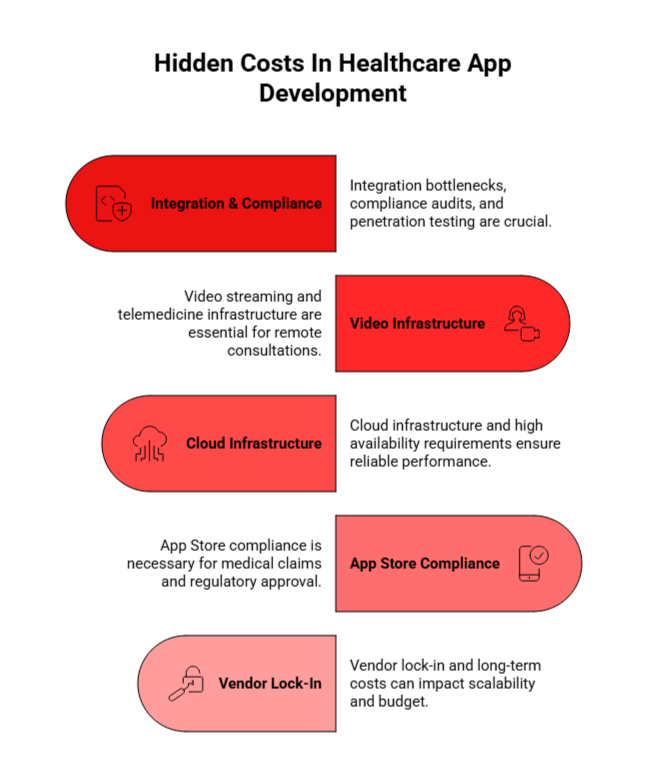
6. Third-Party Integrations
Integrating with systems like EHRs or payment gateways adds complexity and cost, but can significantly enhance the functionality and value of your app.
7. Development Timeline
Longer timelines typically mean higher costs. Complex apps or those requiring multiple revisions will extend the development period, increasing the overall budget.
8. Maintenance and Post-Launch Support
Ongoing maintenance and updates to ensure security and compliance are essential, but add to the long-term costs of developing a healthcare app.
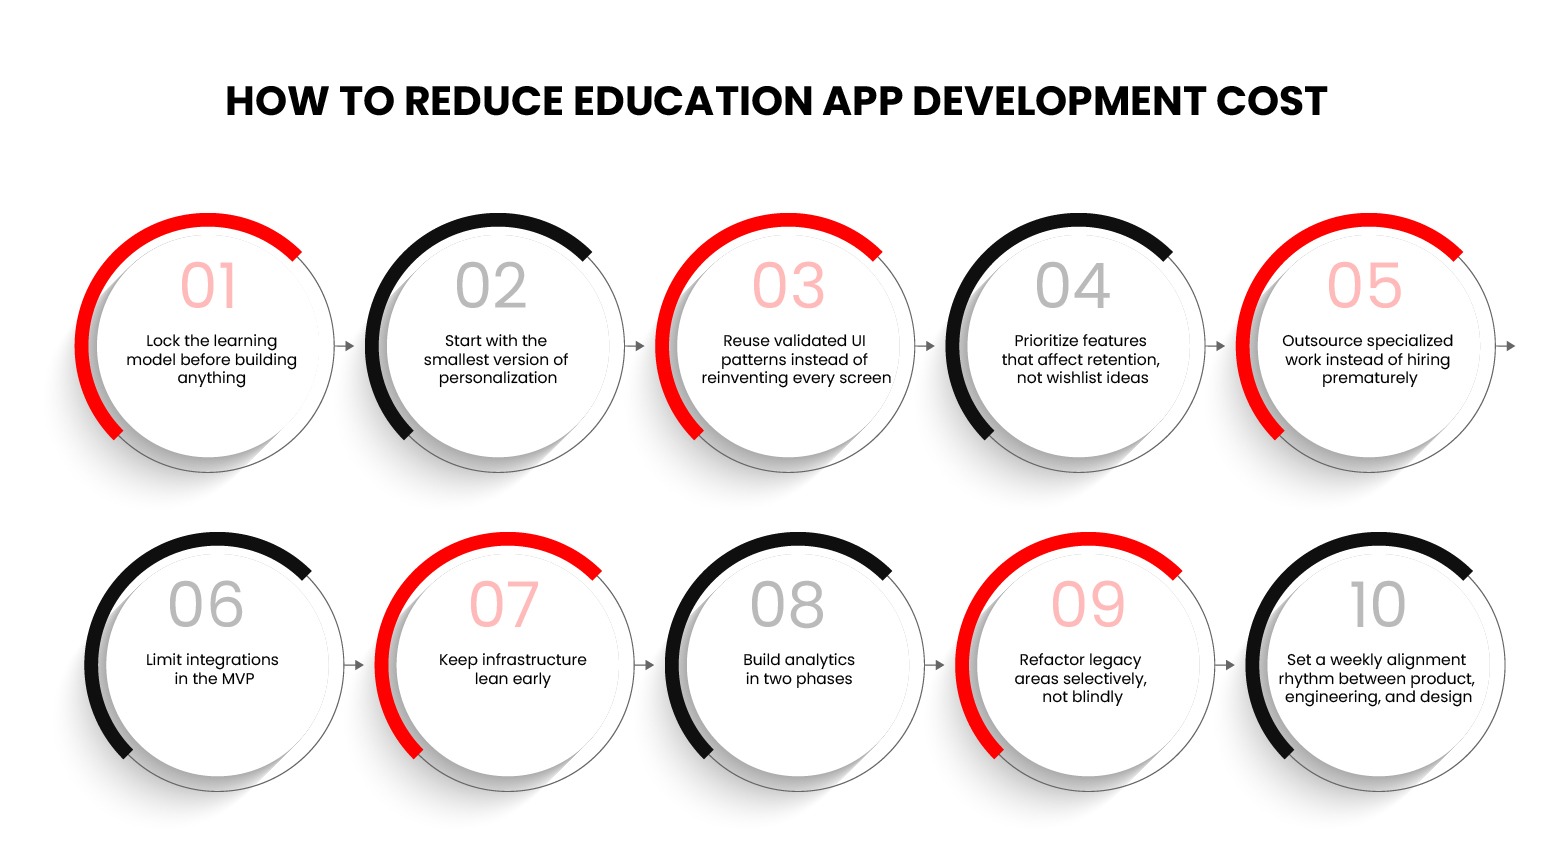
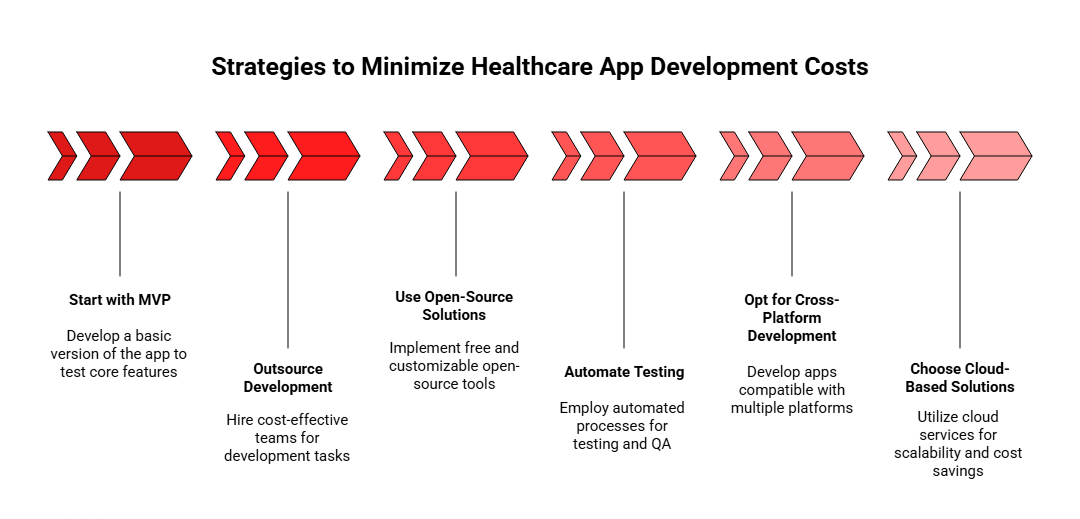
Key Insight: Pre-built components can reduce development costs by 20-30%, while fully custom solutions will have a higher initial cost but offer better long-term ROI. A hybrid approach combining reusable modules and custom features can strike the right balance.
Make Your Healthcare App Cost-Effective
Ensure your healthcare app stays within budget by working with an experienced team that understands Dubai’s regulatory environment and development challenges.
How Do UAE Compliance and Security Requirements Influence Costs?
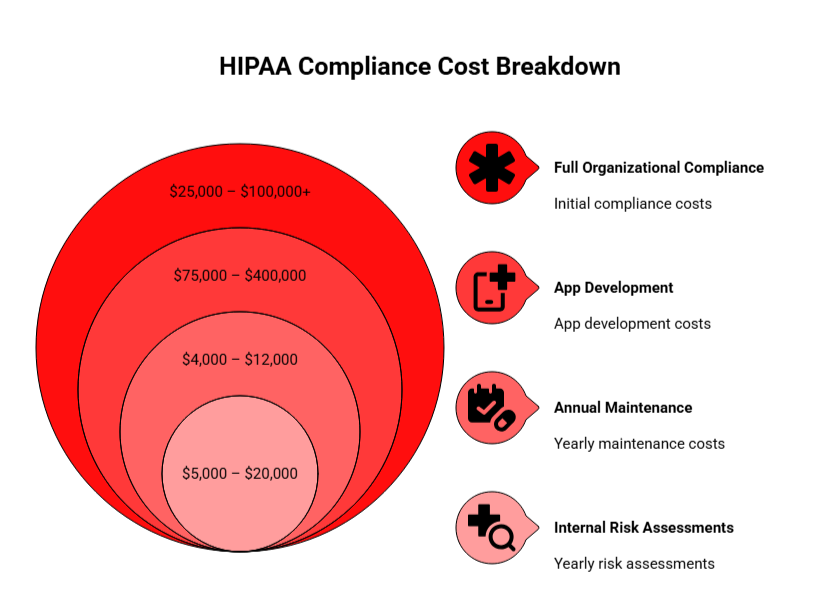
Whether you’re investing in healthcare apps or healthcare software development, it is critical to comply with various regulations such as DHA, HIPAA, and GDPR. Implementing these compliance and security measures adds significant costs to the overall budget.
| Compliance Type | Cost Range | Timeline | Key Requirements |
|---|---|---|---|
| DHA Compliance | AED 37,000 – AED 92,000 (USD 10,000 – 25,000) | 1 – 2 weeks | Data residency, encryption, audit trails, cybersecurity standards |
| HIPAA Compliance | $15,000 – $50,000 | 2 – 4 weeks | End-to-end encryption, multi-factor authentication, security audits |
| GDPR Compliance | $5,000 – $15,000 | Varies | Data minimization, consent management, right to erasure |
Key Insight: Compliance and security can add 20-40% to base development costs, with additional ongoing costs for security audits and penetration testing.
What Role Does the Development Team’s Expertise Play in the Cost?
The experience level of your development team plays a critical role in determining the overall cost. Senior developers can expedite development, reduce errors, and ensure compliance, thus lowering long-term costs despite higher hourly rates.
| Experience Level | Hourly Rate (AED) | Hourly Rate (USD) | Key Capabilities |
|---|---|---|---|
| Junior Developer | AED 75 – 150 | $20 – $40 | Basic features, simple UI/UX |
| Mid-Level Developer | AED 150 – 220 | $40 – $60 | Complex features, API integration |
| Senior Developer | AED 220 – 330 | $60 – $90 | System architecture, healthcare compliance |
| Healthcare Domain Expert | AED 290 – 370+ | $80 – $100+ | Regulatory expertise, EHR integration, clinical workflows |
Key Insight: Hiring senior developers or specialized experts in healthcare regulations can reduce project costs by 25-30% due to fewer development cycles and faster compliance implementation.
What Is The Impact of Platform Choice Over Development Costs: iOS vs. Android vs. Cross-Platform?
Your platform choice significantly impacts both development costs and time. Whether you’re building a healthcare mobile app or a healthcare web development solution, the choice between iOS, Android, or cross-platform will affect your project’s overall cost, scalability, and market reach.
Here’s a comparison of the development costs for healthcare app development on iOS, Android, and cross-platform frameworks like Flutter or React Native.
| Platform Strategy | Cost Range (AED) | Development Time | Pros | Cons |
|---|---|---|---|---|
| iOS Only | AED 146,800 – AED 734,000 | 3 – 8 months | Enhanced security, premium UX, Apple Health integration | Limited market reach (30–35% in MENA) |
| Android Only | AED 128,450 – AED 661,000 | 3 – 8 months | Broader market reach (65–70% in MENA), flexible integration | Device fragmentation challenges |
| Cross-Platform (Flutter / React Native) | AED 202,850 – AED 918,000 | 4 – 10 months | 30–40% cost savings, single codebase, faster deployment | Performance limitations for complex features |
What is the Impact of UX/UI Design and User Experience on the Budget?
Investing in high-quality UX/UI design is critical for user satisfaction and long-term success. Poor design can lead to high rework costs and low user adoption rates, while a well-thought-out design minimizes these issues and optimizes the overall project cost.
Here’s a breakdown of design investment costs for healthcare app development:
| Design Investment | Cost Range (AED) | Development Time | Key Features |
|---|---|---|---|
| Basic Template Design | AED 18,350 – AED 36,700 | 2 – 4 weeks | Pre-designed templates, minimal customization |
| Custom UI/UX Design | AED 36,700 – AED 110,100 | 4 – 8 weeks | Tailored interfaces, better user flow, accessibility |
| Advanced Design with Animation | AED 110,100 – AED 183,500 | 8 – 12 weeks | Custom animations, interactive UI, complex visual design |
How Much Do Healthcare App Developers Charge Per Hour In Dubai?
The cost of hiring healthcare app developers in Dubai varies significantly based on their expertise and the type of development team. Below, we break down the typical hourly rates you can expect based on developer experience and team structure.
Hourly Rates by Expertise and Experience Level
The hourly rate for developers in Dubai ranges from AED 75 to AED 330, depending on their role and experience. Here’s a general overview of the rates:
- Junior Developers (0-2 years): AED 75-110/hour ($20-$30)
- Mid-Level Developers (2-5 years): AED 110-185/hour ($30-$50)
- Senior Developers (5-10 years): AED 185-260/hour ($50-$70)
- Expert Developers (10+ years): AED 260-330/hour ($70-$90)
Other roles, such as UI/UX designers, QA engineers, and domain experts, follow a similar pricing pattern, with senior roles charging up to AED 470+/hour ($130+).
The average blended rate for healthcare app developers in Dubai falls between AED 150-250/hour ($40-$68/hour).
Hourly Rates by Type of Development Team (Freelance vs. Agency)
When deciding between freelancers and agencies, the pricing models differ greatly:
Freelance Developers: AED 100-200/hour ($25-$55/hour), with monthly retainers ranging from AED 8,000 to AED 15,000 ($2,200 – $4,100).
- Pros: 40-60% cost savings, flexible engagement, direct communication.
- Cons: Limited skill diversity, lower accountability, and no backup resources.
Small Development Agencies: AED 180-280/hour ($50-$75/hour).
- Pros: Multiple skill sets, better project management.
- Cons: Limited scalability, may lack healthcare expertise.
Mid-Sized Agencies: AED 220-370/hour ($60-$100/hour).
- Pros: Comprehensive services, better support, UAE healthcare compliance experience.
- Cons: Higher cost than freelancers.
Large Enterprise Agencies: AED 290-440+/hour ($80-$120+/hour).
- Pros: Deep healthcare expertise, enterprise-grade security, full compliance support.
- Cons: Premium pricing, longer onboarding.
Cost Comparison Example for a 6-Month Project
| Development Team | Cost Range |
|---|---|
| Freelancer Team | $60,000 – $90,000 |
| Small Agency | $100,000 – $150,000 |
| Mid-Sized Agency | $150,000 – $250,000 |
| Large Agency | $250,000 – $400,000+ |
Choosing between freelancers and agencies depends on your project scale and budget. Freelancers are great for smaller projects, while agencies are better suited for larger, more complex healthcare apps.
How Long Does It Take To Develop A Healthcare App In Dubai?
The development timeline for healthcare apps in Dubai can vary significantly based on app complexity and features. Below is a concise breakdown of estimated timelines for different types of apps:
Estimated Development Time for Simple vs. Complex Apps
| App Complexity | Estimated Development Time | Team Size | Key Features |
|---|---|---|---|
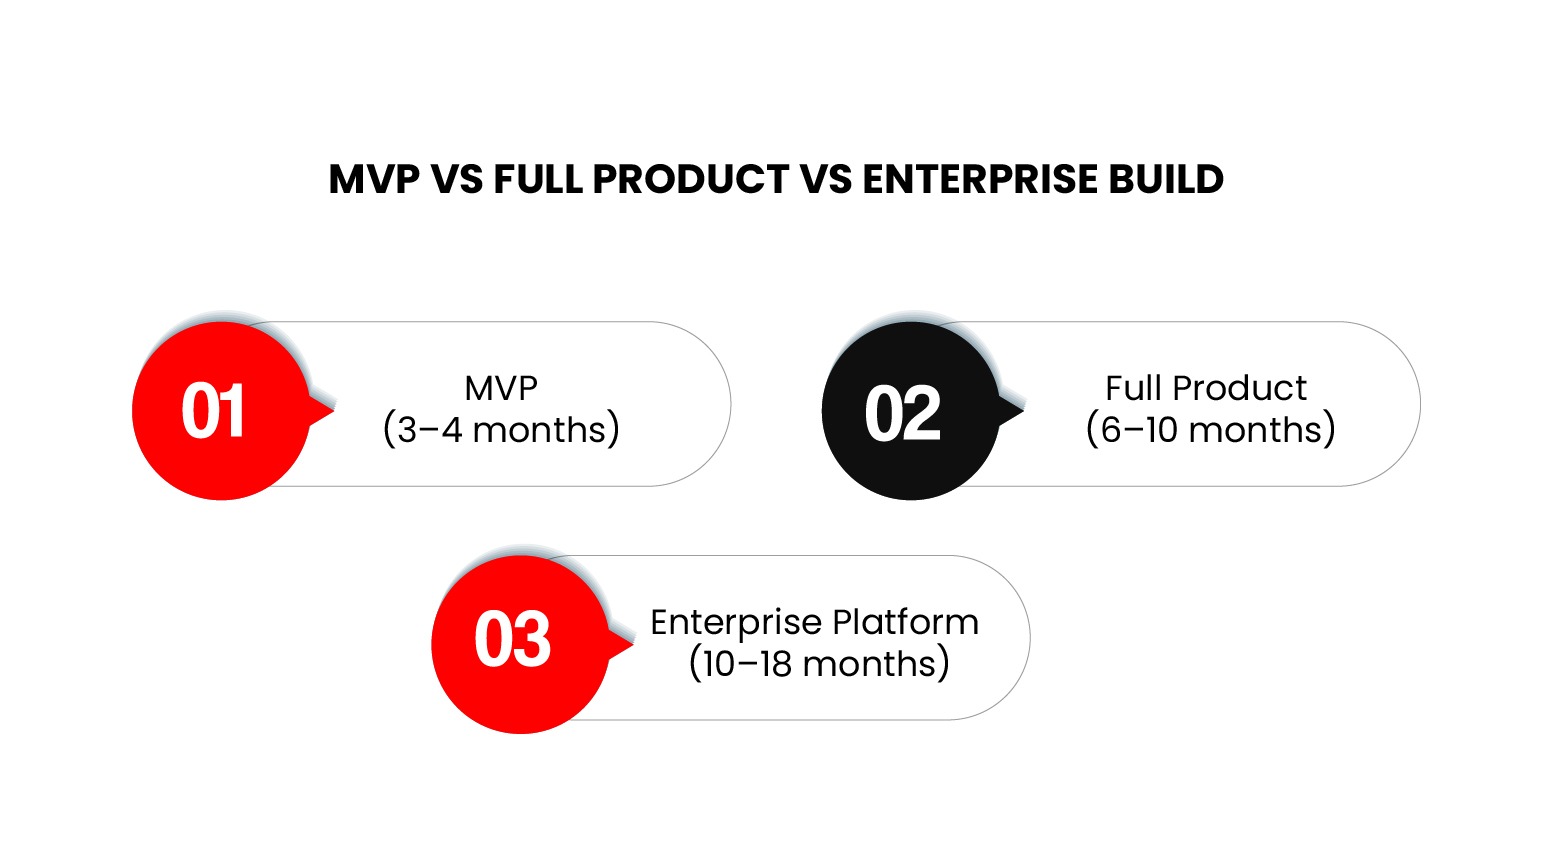
| Simple MVP | 3 – 6 months | Small team (3–5 people) | Basic features, minimal integrations |
| Mid-Complexity | 6 – 12 months | Medium team (6–10 people) | Telemedicine, EHR integration, cross-platform |
| Advanced / Enterprise | 12 – 18+ months | Large team (10–15+ people) | Multiple integrations, AI/ML, full compliance |
Timeline by App Type
Here is the timeline and cost breakdown for different healthcare app types:
| Healthcare App Type | Estimated Timeline | Cost Range |
|---|---|---|
| Appointment Booking | 6 – 12 weeks | $50,000 – $75,000 |
| Fitness & Wellness | 8 – 20 weeks | $55,000 – $120,000 |
| Telemedicine (Basic) | 16 – 24 weeks | $150,000 – $250,000 |
| Telemedicine (Advanced) | 24 – 32+ weeks | $300,000 – $450,000 |
| Chronic Disease Management | 15 – 40 weeks | $65,000 – $280,000 |
| EHR/EMR Integration | 12 – 24 weeks | $50,000 – $150,000 |
| Hospital Management System | 40 – 60+ weeks | $400,000 – $800,000+ |
Key Development Phases & Timelines
- Discovery & Planning (2-4 weeks): Market research, requirement gathering, and technical feasibility.
- Design & Prototyping (4-8 weeks): UX research, wireframing, and visual design.
- Development & Integration (8-20+ weeks): Frontend, backend, and third-party integrations.
- Testing & Quality Assurance (2-6 weeks): Functional, security, and usability testing.
- Deployment & Launch (1-3 weeks): App store submission, server setup, and soft launch.
Critical Path Items That Extend Timelines
- Vendor Certifications (4-8 weeks for EHR vendors)
- App Store Review (1-2 weeks, or longer with rejections)
- Security Audits (2-4 weeks)
- Regulatory Approvals (Variable, depending on DHA, FDA, etc.)
Total development time ranges from 6 weeks to 18+ months, depending on the complexity of the app and specific integrations required.
Why Should You Choose Dubai for Healthcare App Development?
Dubai offers a robust environment for healthcare app development, backed by its world-class infrastructure, strategic location, and comprehensive regulatory framework.
Benefits of Dubai’s Healthcare Sector and App Development Ecosystem
Here’s why Dubai stands out as the ideal hub for healthcare innovation:
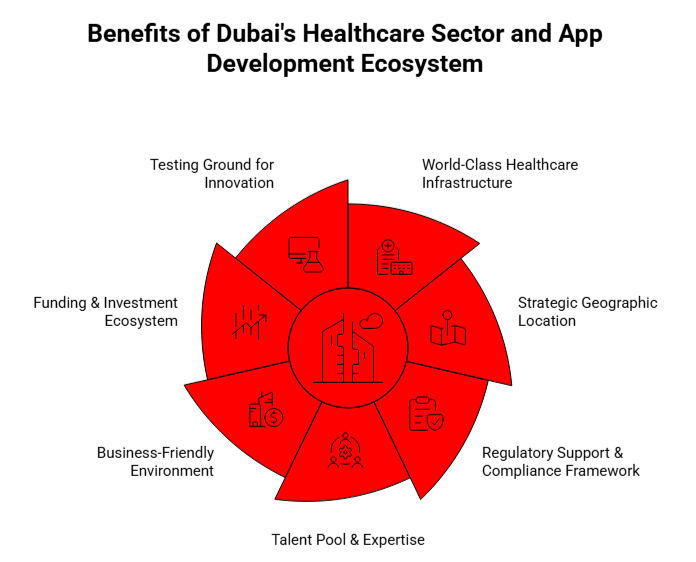
World-Class Healthcare Infrastructure: Dubai boasts over 50 JCI-accredited hospitals, the highest concentration in the MENA region, and attracts over 1 million medical tourists annually. With 75% of hospitals equipped with EMR systems and 5G coverage enabling telemedicine, the city is advancing in digital health.
Strategic Geographic Location: Located as a regional hub, Dubai provides access to 2 billion people within a 4-hour flight, facilitating easy expansion across MENA markets. Its high digital penetration, with 96% smartphone usage and 99% internet coverage, enhances connectivity.
Regulatory Support & Compliance Framework: Dubai’s DHA framework offers fast-track approvals and clear regulatory pathways. The city aligns with international standards, including WHO, HIPAA, and EU regulations, ensuring apps meet global compliance benchmarks.
Talent Pool & Expertise: Home to over 25,000 tech professionals, Dubai’s growing pool of healthcare IT experts is equipped to tackle emerging challenges. The city’s multilingual workforce, fluent in English, Arabic, and other languages, fosters effective communication across teams.
Business-Friendly Environment: Dubai offers a zero corporate tax incentive for companies in free zones, along with 100% foreign ownership. Business setup is quick, with companies able to establish operations in just 48 hours, supported by a strong fintech infrastructure and fast-track work permits.
Funding & Investment Ecosystem: With over $5 billion in healthtech funding for 2023-2025, Dubai is a thriving investment hub. Programs like Hub71 provide healthcare startups with funding of up to $2 million, making it an attractive destination for innovation.
Testing Ground for Innovation: The DHA’s regulatory sandbox allows for the testing of digital health innovations. With Dubai residents being quick adopters of new technologies, it provides an ideal environment for piloting healthcare apps and services.
The Impact of Dubai’s Regulatory Environment on Healthcare App Development
DHA Compliance Framework: All medical data in Dubai must be stored within UAE borders to meet DHA regulations. Compliance with encryption, audit logs, and multi-factor authentication (MFA) is required to ensure data security and privacy.
Licensing & Approval Process: DHA approval for digital health apps typically takes 4-8 weeks. The process is streamlined with clear guidelines, ensuring that apps can quickly enter the market with a solid compliance framework.
Compliance Costs: Initial compliance setup costs range from $31,000 to $88,000, depending on the app’s complexity. Ongoing audits and updates cost between $16,500 and $45,500 annually.
Key Benefits of DHA Compliance: DHA compliance is essential for market access in Dubai and the broader GCC region. It enhances trust, offering a competitive edge and facilitating partnerships with healthcare providers. Additionally, aligning with international standards aids expansion into markets like the US and EU.
Dubai’s healthcare ecosystem provides an unparalleled combination of cutting-edge infrastructure, regulatory support, and access to skilled talent. It’s an ideal location for businesses looking to develop innovative healthcare apps with a clear path to both regional and global success.
Leverage Dubai’s Healthcare Ecosystem for Success
Tap into Dubai’s growing healthcare sector and take advantage of its world-class infrastructure and regulatory advantages. Our team is here to help you develop the perfect healthcare app.
Conclusion
In conclusion, the UAE healthcare app development market is rapidly growing, driven by robust infrastructure and a favorable regulatory environment. As digital health solutions gain momentum across the region, understanding the cost factors, such as complexity, compliance, and development teams, can help you make informed decisions.
By considering key elements like platform choice, app features, and security requirements, you can optimize your budget and timeline. Whether you are looking for a basic app or a complex healthcare solution, there are various strategies to balance cost and quality.
AppVerticals is focused on building healthcare app solutions that align with regional regulations, offering cost-effective development without compromising on quality. With the right approach, your healthcare app can succeed in this thriving market.