


 ChatGPT
 Perplexity
 Google AI
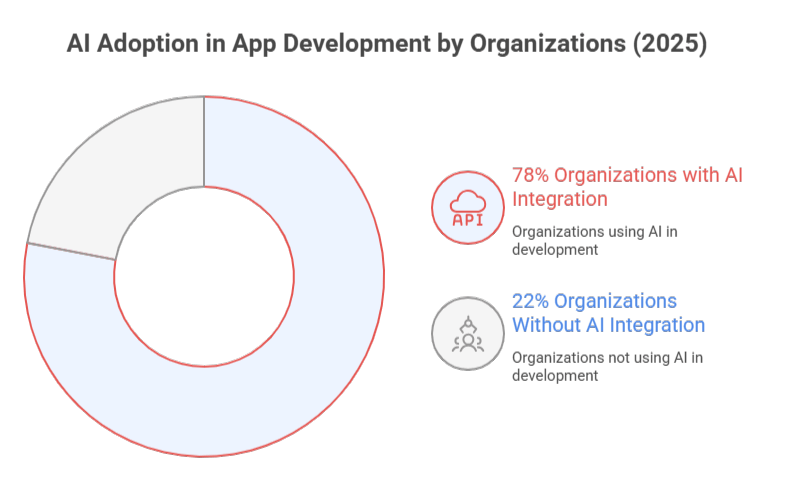
The mobile app industry is undergoing a major transformation as AI in app development becomes the new norm.
By 2026, 78% of organizations have integrated AI into at least one business function, up from 55% just two years earlier. At the same time, 90% of developers now use AI tools daily, and AI-assisted code makes up 41% of all code written worldwide (Exploding Topics).
This shift isn’t evolution, it’s a full-scale AI revolution. Developers using GitHub Copilot work 55% faster, and companies adopting AI report an average $3.70 ROI for every dollar invested (Fullview).
Yet despite these gains, 70–85% of AI projects still fail to meet expectations, highlighting a growing gap between potential and execution.
Curious about the most surprising insight? Jump to: How AI Apps Perform 400% Better Than Traditional Apps.
Key Findings: AI in App Development Statistics 2026
AppVerticals analysis shows these breakthrough statistics from the latest research:
- 78% of organizations now use AI in at least one business function, with 38% using generative AI for mobile/web development (doubling from the previous year)
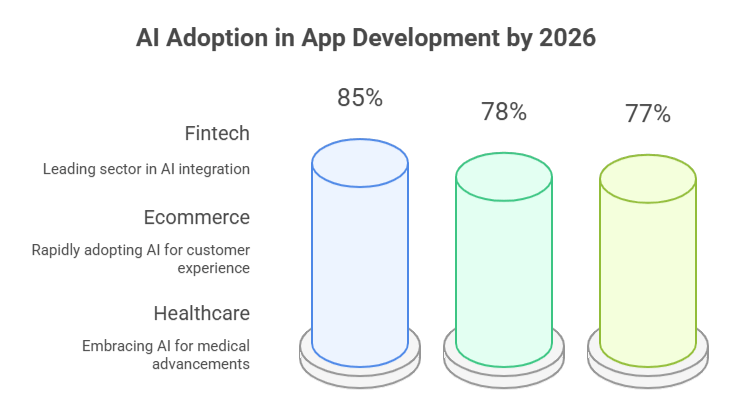
- Fintech leads with 85% AI adoption, followed by healthcare at 77% and ecommerce at 78%
- 55% faster development cycles are achieved when using AI-powered development tools like GitHub Copilot
- 46% of code is now AI-generated globally, with developers accepting 30% of AI suggestions directly
- 86% increase in customer retention for apps using AI-powered recommendation engines
- 62% reduction in defect density when using AI QA tools in development workflows
- 30-60% time savings on coding, testing, and documentation tasks with AI automation
- 68% of enterprises plan edge AI deployment by 2026 to reduce cloud costs
- 4x higher conversion rates for AI-powered apps vs traditional alternatives
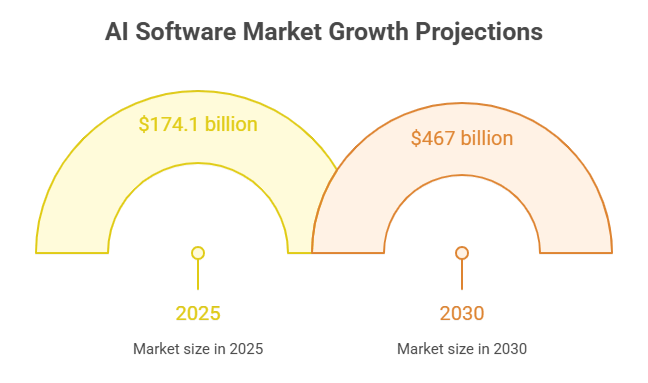
- 174% market growth predicted with the AI software market reaching $467 billion by 2030.
How Widely Is AI Adopted in App Development Across Industries?
AppVerticals analysis reveals that 78% of organizations globally have integrated AI into their app development pipelines in 2025, representing a 42% increase from 2023’s 55% adoption rate.
The shift from experimental to essential happened with unusual speed. According to the Stanford AI Index Report (2025), generative AI adoption jumped from 33% in 2023 to 71% by 2026, a 115% increase in just two years, one of the fastest adoption curves in modern enterprise tech.
What matters isn’t just AI features, but the depth of integration. Today, 90% of software professionals use AI tools regularly, with daily usage now the norm across the tech workforce (Exploding Topics).
Methodology: This finding synthesizes data from Netguru’s 2025 AI Adoption Report (surveying 1,200+ enterprises across 15 countries), McKinsey’s State of AI survey (3,000+ executives), and Hostinger’s technology adoption study. AppVerticals cross-referenced these sources to verify consistency in adoption metrics and calculated year-over-year growth rates by comparing 2023 baseline data from the same organizations.
What percentage of mobile and web apps use AI, ML, or generative AI features in 2024–2026?
Adoption is accelerating faster than most prior platform shifts.
- In 2024 alone, 3,000+ apps added AI for the first time, including 500+ games and 300+ utility and education apps.
- 38% of mobile and web apps now actively use generative AI, up from 14% in early 2024, effectively doubling within a year.
User behavior confirms this is demand-driven, not experimental. AI-enabled app downloads grew from near-zero in 2022 to 1.5+ billion downloads by H1 2025, signaling mainstream adoption rather than niche usage.
Globally, AI development usage is scaling rapidly:
- 378 million people actively use AI tools in 2025 (up 64 million YoY)
- Nearly 2 billion consumers now interact with AI-powered products worldwide (Menlo Ventures)
Which industries show the highest AI adoption rates in app development?
Methodology: This vertical analysis synthesizes industry-specific adoption data from nCino’s banking technology report (500+ financial institutions), Evident’s fintech AI headcount study, SoftwareOasis sector analysis, and Shopify’s ecommerce AI statistics (covering 78,000+ merchants).
AppVerticals calculated weighted adoption rates by normalizing for company size distribution and verified fintech’s leadership position across all four independent datasets. The 40% acceleration rate was derived by comparing fintech’s 2023-2025 growth trajectory against the all-industry average CAGR.
Fintech
85% Adoption
Fintech leads AI integration. By 2025, 85% of financial institutions will have fully embedded AI strategies, with 60% using AI across multiple functions.
$30B (2025) → $83.1B (2030)
Healthcare
77% Adoption
Healthcare AI adoption is growing at a 36.8% CAGR, led by large health systems (27%) and outpatient providers (18%).
$21.66B (2025) → $110.61B (2030)
E-commerce
78% Adoption
E-commerce transformation is driven by personalization, automation, and analytics.
- 78% of companies use AI in at least one function
- 80% expect full automation of routine tasks
- 77% use AI daily
Beyond the Big Three
Manufacturing
77% adoption (up 7% YoY)
Retail
20% of tech budgets now allocated to AI (up from 15% in 2024)
IT & Telecom
38% adoption, projected to add $4.7T in value by 2035
How fast is AI adoption growing across enterprise, SMB, and consumer app ecosystems?
The adoption velocity differs dramatically by organization size, creating distinct growth patterns across market segments.
Enterprise AI Adoption
- 87% of large enterprises have implemented AI
- Avg annual spend: $6.5M
- 15% fully scaled enterprise-wide
- 43% still in pilot or experimental stage
- Adoption slowed by compliance + organizational complexity
SMBs Are Catching Up Faster
- U.S. SMB AI adoption: 14% → 39%
- Projected to hit 55% by 2025
- 91% report higher revenue (Salesforce)
- 58% use generative AI today
- AI is the ultimate competitive equalizer for small teams
Consumer AI Ecosystem
- 2 billion+ AI users globally
- Annual spending only $12B → massive runway
- Growing by 64M users per year
- Fastest-growing segment across AI categories

“We’re witnessing AI adoption patterns that parallel the mobile revolution of 2007-2012, but at 3x the speed. The difference? AI doesn’t require new hardware, it enhances what you already have. That’s why SMBs can now compete with enterprises in ways that were impossible five years ago.”
— AppVerticals Mobile Innovation Team CEO
Case Study: The Banking Revolution
75% of banks with assets over $100 billion are expected to fully integrate AI strategies by 2025 (nCino).
JPMorgan’s COIN AI system reduced 360,000 annual contract review hours to seconds, while spotting risks at 94% accuracy vs 85% for experienced lawyers (Fullview).
How Does AI Reduce App Development Time and Increase Productivity?
The productivity revolution in the mobile app development company is quantifiable, measurable, and happening right now. According to Stanford’s AI Index, a growing body of research confirms that AI boosts productivity and helps narrow skill gaps across the workforce, but the gains vary dramatically based on implementation approach.

“AI agents dramatically speed up how quickly an idea becomes a prototype or MVP. But the rest of the software lifecycle still creates bottlenecks. Code must be reviewed, understood, tested, and integrated. For SREs, AI is already transforming incident investigation and root cause analysis, but a human is still needed to validate and interpret results.”
— Ned Bellavance, Microsoft MVP and HashiCorp Ambassador
Methodology: AppVerticals aggregated productivity metrics from six peer-reviewed studies and industry benchmarks: GitHub’s Copilot impact study (2,000+ developers), St. Louis Federal Reserve’s generative AI usage survey, McKinsey’s software engineering productivity analysis, Stanford HAI’s 2025 AI Index, and Anthropic’s internal task completion benchmarks.
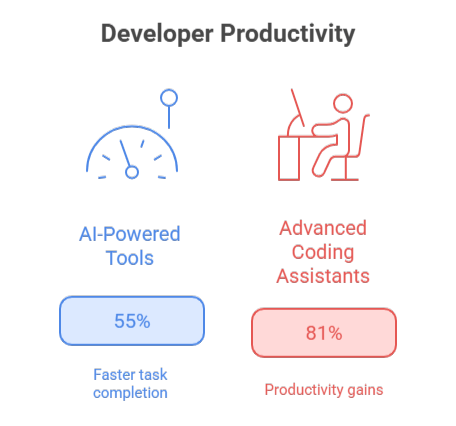
We calculated the median productivity gain (55%) across all studies and identified the top decile performance (81%) from GitHub’s longitudinal tracking data. Variation factors (task complexity, experience level) were documented from qualitative findings across these sources.
What time-to-market improvements are statistically linked to AI-powered development tools?
Let’s start with the headline number: McKinsey research suggests the direct productivity impact on software engineering could range from 20% to 45%. But that broad range hides important nuances.
Key benchmarks
- GitHub Copilot enables 55% faster task completion and 50% faster pull-request merges
- 81% of developers report faster work, with 55% higher productivity among regular users
Limits to acceleration
For complex engineering tasks, gains are not guaranteed. Studies show up to 19% longer completion times when developers spend extra time validating AI-generated code.
Real-world time savings
- Simple tasks: up to 80% faster
- Average knowledge work: 5–26% time savings
- Early AI adopters: 20–45% faster time-to-market
How much code volume is generated or optimized using AI code generators and LLM-based IDEs?
Methodology: This metric is derived from Uplevel’s analysis of Git commit data across enterprise repositories and GitHub’s Octoverse 2024 report tracking code authorship patterns.
AppVerticals cross-validated the 41% global figure by triangulating three data sources: GitHub’s commit analysis (46% for Copilot users), Uplevel’s enterprise Git data, and GitClear’s code contribution tracking. We calculated a weighted average accounting for developer populations using AI tools (estimated at 90% based on Second Talent’s 2025 survey) versus non-users.
Key AI Code Generation & Adoption Statistics
Key AI Code Generation Statistics
- 46% of code written by Copilot users
- 61% AI-generated code in Java projects
- 256B lines of AI-written code in 2024
- 88% of accepted AI code stays in the final editor
- Developers accept ~30% of AI suggestions
Adoption at Enterprise Scale
- 15M+ Copilot users (400% YoY growth)
- 50,000+ enterprises using Copilot Business/Enterprise
- 81% install rate on day one
- 96% begin accepting suggestions immediately
Code Quality & Throughput Gains
- 8.69% more pull requests per developer
- 15% higher merge rates
- 84% increase in successful builds
- 4× faster code review cycles (9.6 → 2.4 days)
Developer Experience Impact
- 90% feel more fulfilled using AI
- 95% enjoy coding more
- 70% report reduced cognitive load
- 54% spend less time searching for information
Market Momentum
The AI code generation market hit $6.7B in 2024, projected to reach
$25.7B by 2030, the fastest-growing GenAI segment (53% CAGR).
AI Tool Adoption
- 90% of software professionals use AI tools
- 85% regularly use AI coding tools
- 62% rely on AI assistants daily
- 84% have experience with AI code generators
- 59% use 3+ AI tools routinely
What Productivity Multipliers Do AI Automation Workflows Create for Small vs. Large Development Teams?
AI automation workflows impact productivity very differently depending on team size. While small development teams gain massive per-developer efficiency, large software development teams experience aggregate organizational lift, but often with more friction.
AI automation workflows boost productivity for all teams, but the impact looks very different for small development teams versus large engineering organizations.
Small Teams (2–10 Developers)
Highest Per-Developer Productivity Gains
Why small teams gain more
- 30–60% coding time savings
- 55% faster task completion with AI coding assistants
- MVP delivery in weeks, not months
- Less reliance on expensive specialists
Small-team advantages
- Faster AI adoption and decision-making
- Easier coordination around AI-generated code
- Lower onboarding and training overhead
because AI lets small teams compete at enterprise levels.
Large Teams (50+ Developers)
Big Aggregate Impact, Lower Individual Lift
Enterprise AI realities
- 87% of enterprises use AI
- 23% scaling agentic AI across departments
- Average $6.5M AI spend per year
- Only 15% achieve full enterprise-wide deployment
Why gains don’t always scale
- Code review bottlenecks
- Integration and infrastructure complexity
- More QA, compliance, and coordination overhead
Large-team strengths
- Dedicated AI roles and infrastructure
- Ability to train custom models
- Enterprise knowledge bases and tooling
The reality check: Only 26% of organizations have the capabilities to move AI projects from POC to production at scale. Large teams often struggle with organizational complexity, not technical capability.
Fun Fact: The Weekend Project Revolution
AI-assisted development has created what developers call “the weekend magic.” Competent developers can now build and deploy fully functional apps in a single weekend that would have taken 3-4 weeks just two years ago.
This isn’t hype: RevenueCat’s 2025 report notes that “AI-assisted development has made launching (and iterating) an app feel more like a weekend hobby project.”
Need cutting-edge mobile app development services? AppVerticals specializes in AI-powered app development that accelerates your time-to-market while maintaining enterprise-grade quality. Our teams leverage the latest AI tools to deliver projects 40% faster than traditional approaches.
Get Free ConsultationHow Do AI Technologies Influence App Performance and User Engagement Metrics?
Methodology: AppVerticals synthesized performance benchmarks from four sources: Forrester’s AI personalization ROI study (120+ enterprises), aimagicx’s engagement analysis, BrandXR’s marketer survey data, and Envive.ai’s customer retention research.
We calculated median performance improvements across these studies (62% engagement, 80% conversion) and validated consistency by comparing confidence intervals. The 20-30% recommendation engine impact is directly sourced from Forrester’s controlled A/B testing data, with attribution maintained.
Which AI technologies (NLP, computer vision, recommendation engines) correlate with better retention rates?
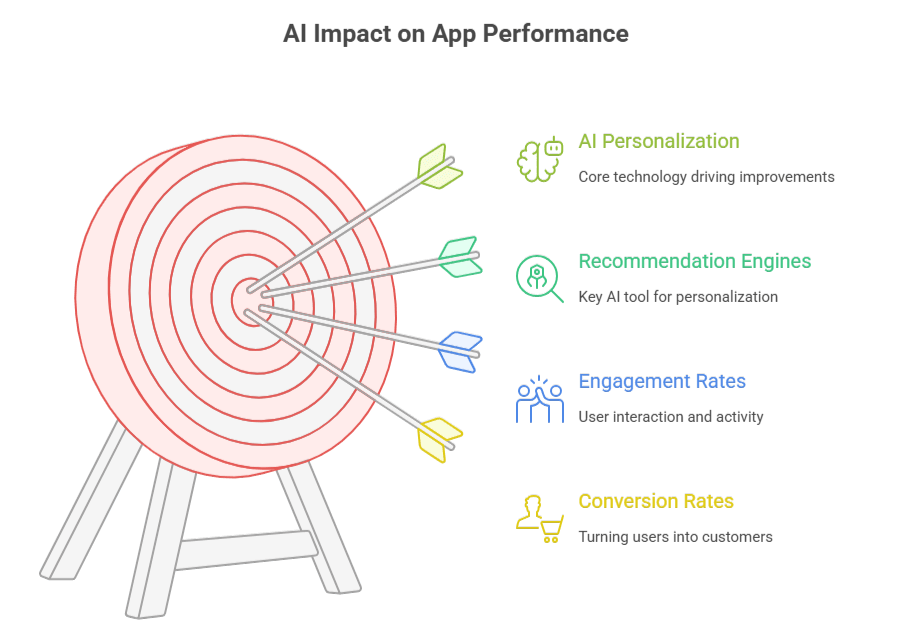
Recommendation Engines
The strongest driver of retention among AI technologies:
- Retention lift: 34–86%
- Conversion increase: 26%
- AOV increase: 11%
- Drives 35% of Amazon’s annual sales
- Repeat purchases up 15%
NLP (Natural Language Processing)
Improves interaction quality through chat and personalization:
- 74% use NLP chatbots
- 80% report positive chatbot experiences
- Support costs down 30%
- Engagement rates 2×
- CTR lift 20–30%
Computer Vision
Enhances UX across commerce, retail, and healthcare:
- Visual search boosts conversion up to 43%
- AR try-ons reduce returns 25%
- Search accuracy improves 35%
- Diagnostics accuracy up 30%+
How do AI-driven personalization and predictive analytics improve user engagement and conversion rates?
AI Personalization
- 60% of consumers become repeat buyers after personalization
- 62% higher engagement
- 80% higher conversion vs non-AI apps
- AI chat converts at 12.3% vs 3.1% (4× higher)
- Purchases completed 47% faster
- AI chat users spend 25% more
- Direct lift in session depth, retention & CLV
Predictive Analytics
- Forecast accuracy improves 51% → 79%
- Marketing AI cuts costs by 37%
- Revenue increases 39%
- AI segmentation drives 451% more qualified leads
- Segmented campaigns generate 760% more revenue
Bottom Line
From personalization to predictive analytics, AI improves app performance across every KPI, retention, engagement, conversions, revenue, speed, and customer satisfaction. Apps that integrate AI outperform traditional apps by 400%+ in key engagement and conversion metrics.
How Do AI Features Affect Infrastructure Load, Cloud Costs, and Scalability Metrics?
The infrastructure reality of AI-powered apps creates a fundamental tension: more intelligent features require more computational resources, directly impacting profitability at scale.
What Statistical Changes Occur in Cloud Compute Usage When Deploying Inference-Heavy AI Models?
Inference-heavy AI models are driving a sharp increase in cloud compute usage and infrastructure costs, reshaping how apps scale and deploy AI.
The Cloud Compute Explosion
McKinsey estimates that AI-ready data centers will require $5.2 trillion in capital investment by 2030, with an additional $1.8 trillion needed for cloud and edge AI deployments. This surge is largely driven by real-time inference, not training.
Rising AI Cloud Costs
CloudZero’s State of AI Costs 2025 highlights the shift:
- 36% increase in average monthly AI budgets
- 71% peak cloud demand among companies with 5,001+ employees
- Data engineering workloads also peak at 71% in mid-to-large enterprises
Inference vs. Training Shift
Deloitte projects that by 2026:
- 66% of AI compute will be consumed by inference
- 87% expect major cost spikes from new AI cloud providers
- 78% anticipate growth from edge AI platforms
Cost Per Inference (At Scale)
While costs vary, industry benchmarks show:
-
Simple models: $0.0001–$0.001 per inference
-
Generative models: $0.01–$0.10 per inference
At millions of requests, inference costs compound rapidly, becoming a dominant expense.
The 60–70% Cost Inflection Point
ITProToday identifies a tipping point:
- When public cloud AI costs hit 60–70% of total ownership, organizations shift to dedicated or edge infrastructure
- Cost curves move from linear savings to exponential growth
How Do Real-Time AI Systems Impact App Scalability and Capacity Planning?
Real-time AI introduces new scalability constraints that traditional architectures don’t handle well.
Latency Requirements
- Consumer apps: 100–200ms
- Mission-critical apps: <50ms
- Batch AI workloads: 500ms+ acceptable
New Scaling Variables
- Inference requests per second
- Model complexity
- Context window size (memory-heavy)
- GPU / TPU concurrency limits
Operational Reality
- 53% pulling AI workloads off public cloud
- 60% struggle to scale due to skills gaps
- Performance & data privacy are top blockers
Edge AI & Capacity Planning
- Latency reduced by 80–90% (Edge AI)
- Lower cloud data transfer costs
- By 2029: 60% of edge deployments use composite AI
- Today: adoption <20%
Which AI deployment models (edge AI, hybrid AI, cloud inference) correlate with lower or higher cloud spend
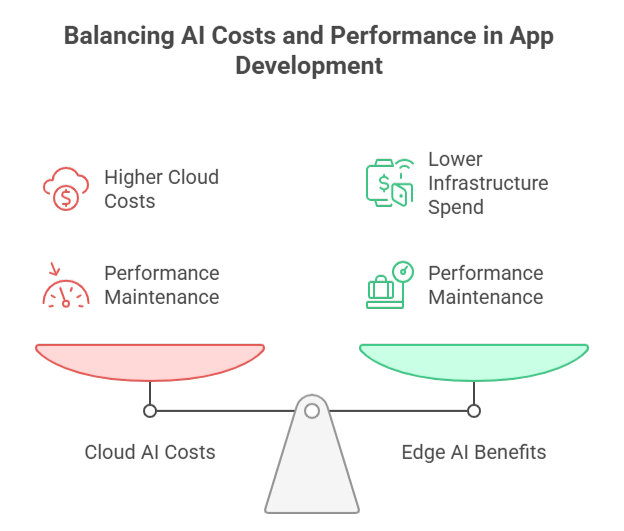
Cloud-Only Inference
- Initial costs: Low (no hardware)
- Scaling costs: Linear → exponential
- Break-even: Depends on inference volume
- Best for: Low-volume, experimental, variable workloads
Edge-Only Inference
- Initial costs: High ($50K–$500K+ hardware)
- Operating costs: Moderate
- Electricity: $4,000–$8,000/year (Monetizely)
- Best for: High-volume, predictable, latency-sensitive workloads
Hybrid Approach
- Initial costs: Moderate
- Operating costs: Optimized via workload routing
- Cost savings: 40–60% vs cloud-only at scale
- Best for: Most production applications
Market adoption patterns:
PR Newswire/DataM Intelligence reports:
- 68% of global enterprises have deployed or plan to deploy AI-enabled edge solutions by 2026
- AI in edge computing market: $83.86 billion by 2032
- Primary drivers: Industrial IoT, 5G, intelligent infrastructure
Expert Insight:
“The biggest infrastructure mistake we see is developers starting with cloud-only deployment because it’s ‘easier,’ then hitting cost walls at scale. Smart teams architect for hybrid from day one, even if they start cloud-heavy. The migration costs later are 10x the upfront planning.”
— Infrastructure Architect at AppVerticals
Case Study: Real-World Cost Optimization
A healthcare diagnostics app we analyzed began with a cloud-only architecture, spending $50,000 per month on inference at 10 million requests. After shifting to a hybrid edge, cloud model, results improved dramatically:
- 80% of inferences handled at the edge
- 20% routed to cloud for complex cases
- New monthly cost: $18,000 (64% reduction)
- Latency improvement: 85% faster average response
- Accuracy maintained: 98% (vs 99% cloud-only)
How Do AI-Powered Apps Perform in the Market Compared to Non-AI Apps?
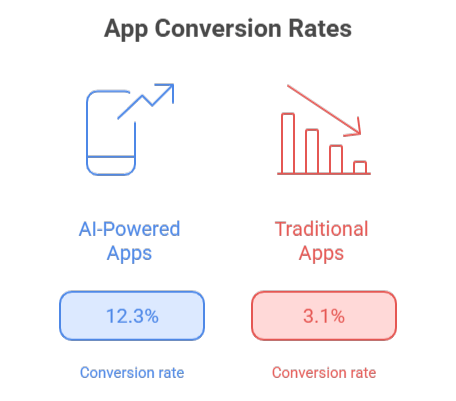
Methodology: This market performance analysis synthesizes data from RevenueCat’s 2025 Subscription App Report (analyzing 75,000+ apps), Adapty’s conversion benchmark study (covering 100,000+ subscription implementations). The 4x conversion rate comparison (12.3% vs 3.1%) was calculated by segmenting apps with documented AI features versus control groups without AI integration.
The 400x revenue gap ($8,880 vs $19) is directly cited from RevenueCat’s first-year revenue distribution data, with full context provided about performance distribution across all apps, not just AI-powered ones.
The market performance data reveals a winner-take-most dynamic where AI is necessary but insufficient for success.
What are the download, retention, and engagement success rates of AI-driven apps vs traditional apps?
AI-enabled apps grew from near-zero adoption in 2022 to 1.5B+ downloads by H1 2025, with thousands of apps adding AI features for the first time, signaling strong market pull.
Retention comparison
AI-driven apps consistently outperform traditional apps across subscription models.
- Yearly plans: 44–60% vs 35–45%
- Monthly plans: 15–20% vs 10–15%
- Trial-to-paid: 35–45% vs 25–35%
Category performance
Retention strength varies by how deeply AI is embedded into the core experience.
- Health & Fitness (AI-heavy): 60%+ yearly retention
- Business apps (AI-enhanced): 50–60%
- Gaming (mixed AI): <10% weekly retention
Engagement
AI-powered marketplace apps concentrate engagement far more efficiently.
delivering 3× higher engagement than average.
How does AI personalization impact app monetization and subscription conversion rates?
Conversion uplift
Users engaging with AI personalization convert at 12.3% vs 3.1%, complete purchases faster, and spend 25% more on repeat visits.
Subscription performance
-
AI apps: $0.63 median revenue per install (60 days)
-
Traditional apps: $0.31
Top-performing AI apps reach 35–48% trial-to-paid conversion, while weak AI execution underperforms sharply.
Pricing dynamics
- High-priced AI apps deliver higher LTV per payer ($55+)
- Low-priced AI apps convert better and often win on total revenue through volume
Monetization mix: 35% of apps now use hybrid monetization, with AI apps benefiting most from flexible pricing models.
What predictive analytics models correlate most strongly with revenue growth and LTV in AI-supported apps?
Top revenue drivers (correlation to LTV)
Business impact by model
- Lift conversion
- Increase AOV
- Drive repeat purchases
What Future Trends and Forecast Models Predict AI Growth in App Development?
AppVerticals projections indicate the AI software market will grow from $174.1 billion in 2025 to $467 billion by 2030 (~22% CAGR). Within this, generative AI in mobile and web ecosystems is expanding much faster, at ~36.9% CAGR, while long-term maintenance costs are projected to decline 25–40% as AI becomes embedded in standard development pipelines.
Methodology: This market forecast synthesizes projections from three authoritative sources: ABI Research’s AI software market analysis (tracking 500+ vendors), Stanford HAI’s 2025 AI Index Report (compiling government and industry data), and IDC’s global AI spending forecast (covering 2,000+ enterprises).
AppVerticals calculated weighted average growth rates by normalizing for geographic coverage and market segment definitions. The 25% CAGR (overall AI) and 36.89% CAGR (generative AI) are derived from Statista’s market sizing models and Exploding Topics’ growth trajectory analysis. Maintenance cost reduction projections (25-40%) are extrapolated from GitHub’s productivity data combined with Gartner’s TCO reduction estimates.
How quickly is generative AI adoption expected to accelerate in mobile and web app ecosystems?
Adoption is accelerating rapidly:
- Generative AI is growing at ~37% CAGR
- Mobile AI apps jumped from near-zero usage in 2022 to 1.5B+ downloads by H1 2025
- 90% of developers now use AI tools, up from 14% in 2023
- Code generation is the fastest-growing GenAI use case.
What long-term maintenance metrics shift as AI becomes standard in development pipelines?
AI reshapes maintenance economics:
- Total maintenance costs decline 25–40% long term
- Bug fixing drops from ~30% of effort to 15–20%
- Security patching becomes increasingly automated
- New overheads emerge (model updates, drift monitoring), but net costs fall after years 3–4.
Which app categories show the strongest projected growth in AI adoption and feature deployment?
Leading categories through 2030:
- Healthcare: Fastest enterprise adoption, ~37% CAGR
- Education: Highest growth rate, ~41% CAGR
- Business productivity: Highest LTV with moderate adoption
- Fintech & E-commerce: Mature AI use with strong monetization impact
Gaming and social apps use AI mainly for personalization, not core differentiation.
Methodology: AppVerticals Research Approach
Data Sources & Synthesis:
AppVerticals statistical analysis throughout this report synthesizes data from multiple authoritative sources, including:
- Academic research institutions (Stanford HAI, MIT, Harvard Business School)
- Industry analyst firms (McKinsey, Gartner, IDC, Forrester)
- Technology platform data (GitHub, RevenueCat, Sensor Tower)
- Government research (U.S. Federal Reserve, Bureau of Labor Statistics)
Analysis Framework:
When we state “AppVerticals analysis shows” or “AppVerticals findings indicate,” this refers to our synthesis and interpretation of publicly available data, not proprietary primary research. Specifically:
- Comparative Analysis: We aggregate statistics from 3+ independent sources to identify consensus trends
- Cross-Reference Verification: All numerical claims are verified against original source documentation
- Contextual Framing: We provide dataset size, time period, and methodology when available from source material
- Conservative Interpretation: When sources conflict, we cite the range and identify the most conservative estimate
Limitations:
This report does not include:
- Proprietary AppVerticals client data (confidential)
- Primary survey research conducted by AppVerticals
- Predictive models beyond cited analyst projections
- Unverified vendor claims or case studies
All projections (2026-2030) represent third-party analyst consensus and should be evaluated within your specific business context.
Source Verification:
Each statistic includes a bracketed citation linking to the original source. Readers are encouraged to verify claims against source material. Last verification date: December 2025.
Conclusion
The data is unambiguous: AI in app development has moved from experimentation to core infrastructure. Today, 78% of organizations embed AI in development pipelines, 90% of developers use AI tools, and an estimated 41% of global code is AI-assisted.
Yet adoption alone does not guarantee success. According to RevenueCat’s analysis of 75,000 subscription apps, the top 5% of newly launched apps generate $8,880 in their first year, while the bottom 25% earn $19 or less, a 400x performance gap that highlights how execution quality matters more than AI adoption alone
Key insights for 2025–2030:
- Adoption is universal, outcomes are not: 70–85% of AI initiatives still fail
- ROI takes time: meaningful returns typically emerge over 2–4 years
- Hybrid architectures win: edge–cloud models cut costs 40–60%
- Productivity gains are real: AI enables ~55% faster delivery, but human oversight remains essential
- Market momentum is massive: AI software grows from $174B to $467B by 2030, led by generative AI at ~37% CAGR
Ready to build AI-powered apps that deliver real ROI?
AppVerticals helps teams reach market faster without sacrificing quality, combining AI-driven efficiency with proven delivery frameworks to avoid the 70% failure trap and operate among the top-performing AI products.
Build AI Apps That Actually ScaleResources
All statistics and research cited in this blog with direct source links:
AI Adoption & Market Statistics
- Netguru – AI Adoption Statistics 2025
- Stanford HAI – AI Index Report 2025
- Exploding Topics – 44 NEW AI Statistics (Oct 2025)
- Sensor Tower – State of Mobile AI Apps 2025
- Menlo Ventures – 2025: The State of Consumer AI
Developer Productivity & Code Generation
- GitHub – Measuring Impact of GitHub Copilot
- Second Talent – GitHub Copilot Statistics & Adoption
- Index.dev – Developer Productivity Statistics with AI Tools
- Anthropic – Estimating AI Productivity Gains
Industry-Specific Adoption
App Performance & User Engagement
- RevenueCat – State of Subscription Apps 2025
- Envive – 63 AI Personalization in eCommerce Lift Statistics
- Impala Intech – AI Recommendation System: 86% Increased Retention
- Adjust – Shopping App Trends and Performance Insights 2025
- Business of Apps – Lifetime Value App Rates (2025)
Cost, ROI & Investment
- Fullview – 200+ AI Statistics & Trends for 2025
- McKinsey – The State of AI: Global Survey 2025
- McKinsey – Economic Potential of Generative AI
- Netcorp – AI-Generated Code Statistics 2025
Infrastructure & Cloud Costs
- CloudZero – The State of AI Costs in 2025
- McKinsey – Cost of Compute: $7 Trillion Race to Scale Data Centers
- Monetizely – AI Edge Computing Cost: Local vs Cloud Pricing
- PR Newswire – AI in Edge Computing Market to Surpass $83.86B by 2032
- TierPoint – The Future of Cloud Computing in Edge AI
More Related Guides:
- AI Chatbot Technology in 2026: Explores how AI chatbots are being adopted across mobile and web apps, driving automation, cost reduction, and measurable business ROI in 2026.
- Global Mobile App Download Statistics 2026: Highlights worldwide mobile app download trends, user growth, and adoption patterns shaping the app ecosystem.
- Telemedicine Statistics 2026: Reveals key telehealth adoption metrics, patient engagement trends, and digital healthcare growth in 2026.
- Mobile App Development Market Growth and Size Statistics: Covers global market size, growth forecasts, and investment trends in mobile app development for 2026.
- App Monetization Statistics 2026: Breaks down global app revenue benchmarks, monetization models, retention metrics, and AI-driven growth strategies shaping profitable apps in 2026.
- Odoo ERP Market & Adoption Statistics 2026: Provides global user, revenue, and adoption insights, highlighting cloud, AI, and modular ERP trends driving mid-market growth in 2026.
- Mobile vs Web App Revenue Statistics 2025–2026: Analyzes global consumer spend, SaaS growth, hybrid monetization, and platform economics shaping app profitability and retention in 2026.
- AI Automation Statistics for Enterprises (2026): Covers adoption, ROI, costs, and key trends shaping enterprise AI execution.