


Mobile app monetization is no longer experimental; it’s a $1.2 trillion global economy projected for 2026, with consumer spending on apps hitting ~$155.8 billion in 2025 and in‑app advertising generating ~$390 billion.
Developers and founders who treat monetization as product strategy from day one capture far more value than those who consider it an afterthought. This post distills the most important statistics every app maker must know in 2026, including revenue benchmarks, platform performance, and category-specific trends.
At AppVerticals, we work closely with founders and product teams to design monetization architectures that scale with user growth. The data in this report reflects both current industry benchmarks and patterns we consistently see across apps moving from launch to revenue optimization.
Key Takeaways | App Monetization Statistics in 2026
- Monetization is product architecture: At AppVerticals, we see revenue decisions shaping onboarding, UX, and retention from day one. Apps that optimize onboarding see up to 40 % higher 30-day retention.
- Hybrid monetization wins: Combining ads, subscriptions, and IAPs improves lifetime value by ~30 % over single-stream models.
- Scale ≠ revenue: Strong retention, engagement depth, and monetization timing drive revenue more than download volume. Apps with 100,000 MAU can generate $5K–$100K/month, depending on monetization.
- iOS drives premium revenue; Android drives reach: iOS users spend ~$12.77/app on average vs. ~$6.19 on Android. Android dominates installs (~60–70 % globally).
- Retention is the real monetization engine: Average 30-day retention across apps is ~27 %, reinforcing that early engagement determines a monetizable user pool.
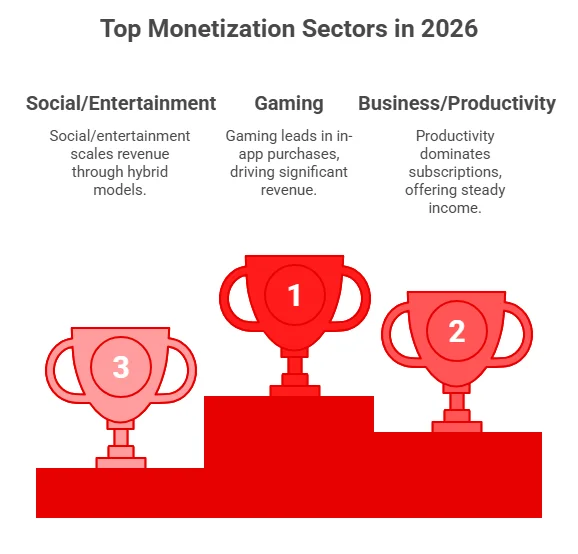
- Category-specific monetization: Gaming leads in IAP (~$81.8 billion revenue in 2025), productivity dominates subscriptions (~30 % of users subscribe monthly), and social apps scale via hybrid models.
- AI personalization is a revenue multiplier: Dynamic paywalls and predictive churn modeling can improve conversion by 15–25 %.
- First-party data is the new advertising advantage: Apps with strong behavioral data generate up to 2× higher ad revenue than those relying on third-party targeting.
- Web-to-app monetization is rising: Subscription-first products increasingly capture revenue outside app stores, improving flexibility and ARPU.
- Core insight: Successful apps treat monetization as a built-in growth system, not a post-launch feature, aligning product design with measurable outcomes.
Global App Revenue Forecast: How Big Is the Mobile Monetization Market in 2026?
The mobile app market continues to scale rapidly, with both user spending and advertising dollars surging:
- In‑app advertising was the largest revenue stream worldwide in 2025, with spending around $390 billion, accounting for roughly two‑thirds of total mobile app revenue that year.
- Global consumer spending on all mobile apps reached ~$155.8 billion in 2025, driven mainly by in‑app purchases and subscriptions.
- In‑app purchase (IAP) revenue hit $167 billion in 2025, growing ~10 % year‑over‑year.
- Subscription revenue remains a fast‑growing segment, with paid subscriptions generating $120 billion in 2025, and average monthly subscription fees rising to around $10.20.
- A broader forecast suggests the global mobile app monetization market could reach $1.2 trillion by 2026, underscoring the scale of opportunity.
AppVerticals experts see in‑app purchase and subscription revenue extending its growth trajectory in 2026, following $167 billion in global IAP revenue in 2025 and rising overall app consumer spend of $155.8 billion.
How Do iOS and Android Compare for App Revenue in 2026?
iOS dominates revenue and ARPU, while Android dominates installs and ad-driven scale, making iOS ideal for premium monetization and Android essential for massive reach. Platform choice matters for revenue strategy:
| Metric | iOS | Android |
|---|---|---|
| Revenue share (global) | ~60–65% of total app revenue | ~35–40% of total app revenue |
| Install share (global) | ~30–40% of total installs | ~60–70% of total installs |
| User spend per user (general insight) | Higher spend per user (developers report iOS users outspend Android users) | Lower spend per user |
Insight: Prioritize iOS if subscription and high ARPU are critical early in your monetization journey; use Android for reach and ad-driven scale. At AppVerticals, platform sequencing is a major revenue lever. Many subscription-first apps launch on iOS to validate monetization, then expand to Android for broader acquisition and ad-driven scale.
How Does User Retention Impact App Monetization
Monetization only works if users stay engaged:
- Average 30‑day retention across apps is still relatively low, about 27 % in 2025, reinforcing that early churn is the monetization bottleneck.
- Push notifications and personalized onboarding can improve early retention metrics.
Locking in engagement early dramatically increases the pool of users who can be monetized, whether through ads, IAPs, or subscriptions.
Turn App Monetization Data Into Real Revenue
Monetization isn’t a feature. It’s architecture. We design apps built for retention, scale, and predictable revenue from day one.
Which Mobile App Categories Drive the Most Monetization?
Gaming Apps
Gaming remains one of the most lucrative categories: in 2025, mobile games generated approximately $81.8 billion in IAP revenue, according to Sensor Tower’s State of Mobile 2026 report.
Industry forecasts suggest that the broader mobile gaming market, including advertising, IAP, subscriptions, and other revenue streams, is expected to grow significantly in the coming years, potentially reaching over $230 billion by 2030 as smartphone penetration, live‑ops engagement, and hybrid monetization strategies expand globally.
Games with diverse monetization features (rewarded ads, battle passes, skins) see the highest spending activity.
Subscription‑Heavy Categories
Business and productivity apps generally drive stronger conversions from free to paid models, thanks to clear ongoing value and premium features. According to ZipDo, in 2023, subscription-based apps generated $212 billion globally, with productivity apps among the top contributors.
Social & Streaming Apps
Social and entertainment apps often combine ad‑driven revenue with optional premium tiers, striking a balance between massive free reach and subscription monetization (market trend: hybrid outcomes).
Monetization Insights: While these patterns are common in social apps, our mobile app development experience at AppVerticals shows that revenue success depends less on app category and more on how clearly value is communicated from the first user interaction.
When a monetization strategy is built directly into the product architecture and aligned with core user motivation, even non-traditional apps can outperform industry benchmarks. This makes early development decisions critical for long-term revenue performance.
How Much Do Mobile Apps Actually Earn in 2026 (By MAU & Downloads)?
Mobile app revenue in 2026 ranges from $10 per month for small apps to $10M+ per month for apps with 1M+ MAU, depending on monetization architecture, retention, engagement depth, and ARPU.
Revenue does not scale linearly with downloads; it scales with monetization design.
Revenue by App Scale (Industry Benchmarks)
| App Scale | Typical Monthly Revenue Range |
|---|---|
| 1,000 downloads | ~$10 – $100+ (ad-heavy or low ARPU) |
| 10,000 downloads | ~$300 – $2,000 (freemium + ads) |
| 100,000 MAU | ~$5,000 – $100,000+ (hybrid monetization) |
| 1M+ MAU | ~$500,000 – $10M+ (optimized monetization) |
These ranges show one clear pattern: monetization architecture matters more than raw downloads.
At AppVerticals, we consistently help founders shift focus from “how many installs?” to:
- Retention quality
- Engagement depth
- Monetization timing
- Revenue per active user
Those are the real drivers behind these benchmarks.
Revenue by Monetization Model (2026 Data)
Different monetization models produce vastly different revenue outcomes depending on category, engagement depth, and user intent.
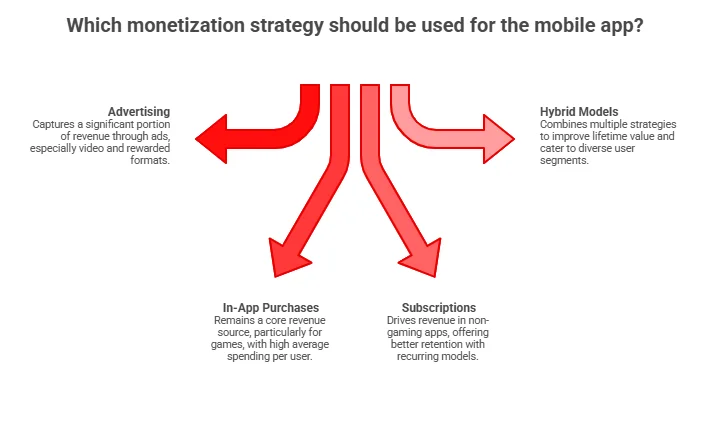
Advertising
- Ads account for ~65% of total mobile app revenue (2024–25).
- Rewarded and video ads generate higher engagement and premium CPMs, especially in gaming.
In-App Purchases (IAPs)
- IAPs remain dominant in gaming, contributing ~60% of total IAP revenue globally.
- Average IAP per paying gamer: ~$16.87 (early 2026)
- Only ~4.2% of gamers convert — proving monetization depends on optimizing high-intent users.
Subscriptions
- Subscription revenue continues to grow strongly across productivity, streaming, and AI apps.
- ~30% of mobile users subscribe to at least one app monthly.
- Subscription apps typically show stronger retention than ad-only models.
Hybrid Models Win
At AppVerticals, we rarely recommend single-stream monetization unless the product is highly niche. Hybrid systems allow apps to monetize:
- Casual users (ads)
- Power users (IAPs)
- High-intent segments (subscriptions)
Without compromising user experience.
Expert Opinion
App monetization is moving away from static paywalls and flat subscriptions toward intelligent, outcome-aligned value exchange. Today, successful apps tie revenue directly to measurable results by charging per usage, per outcome, or per performance metric rather than for vague access.
For example, Duolingo blends freemium access with Super subscriptions and microtransactions like streak freezes, monetizing engagement rather than forcing upfront payment. OpenAI prices API access based on usage, directly aligning revenue with compute consumption. Canva layers free access with Pro subscriptions and paid asset libraries, creating a hybrid monetization stack instead of a single paywall.
We’re also seeing marketplace-driven models like Shopify, which combines subscription tiers with revenue share and embedded payments. Monetization is no longer a pricing-page decision; it’s a product design decision embedded into discovery, experimentation, and behavioral strategy.
Core Takeaway: In 2026, successful apps don’t ask “How do we charge?” They ask, “Where does value naturally occur in the user journey?” Revenue follows architecture, not installs.
2026 App Monetization Trends Every Founder Should Know
Top app monetization trends in 2026 include hybrid revenue models, AI-driven personalization, rewarded ads, subscription growth, and premium AI features, all focused on maximizing retention, conversions, and lifetime value.
- AI‑Driven Personalization: Apps leveraging AI for personalization, including paywall timing, dynamic pricing, and churn prediction, are seeing marked improvements in conversion and retention metrics. For example, apps using AI‑powered personalization report up to ~62 % higher engagement and ~80 % higher conversions compared with non‑AI apps.
In enterprise contexts, AI personalization can boost conversion by ~18 % and cut churn by up to ~15 %. Personalized pricing and offer recommendations further drive 10–30 % higher ARPU by matching offers to user behavior at the right moment. These outcomes confirm that AI not only increases engagement:*
- Precision Advertising: Privacy changes have reshaped ad targeting, but apps with strong first‑party data continue commanding premium ad yields.
- Web‑to‑App Monetization: External payment flows and web funnels are growing, enabling revenue capture outside traditional app store restrictions, particularly for subscription products.
Expert Opinion
AI-generated code does not emerge from creativity. It emerges from patterns. When insecure patterns appear in training data, they are not copied once. They are reproduced thousands of times across unrelated applications. What used to be isolated developer mistakes can become systemic weaknesses. This does not mean AI should be avoided. Used correctly, AI is an extraordinary tool. But security cannot be automated by generation alone. Growth is inevitable. Resilience is a choice
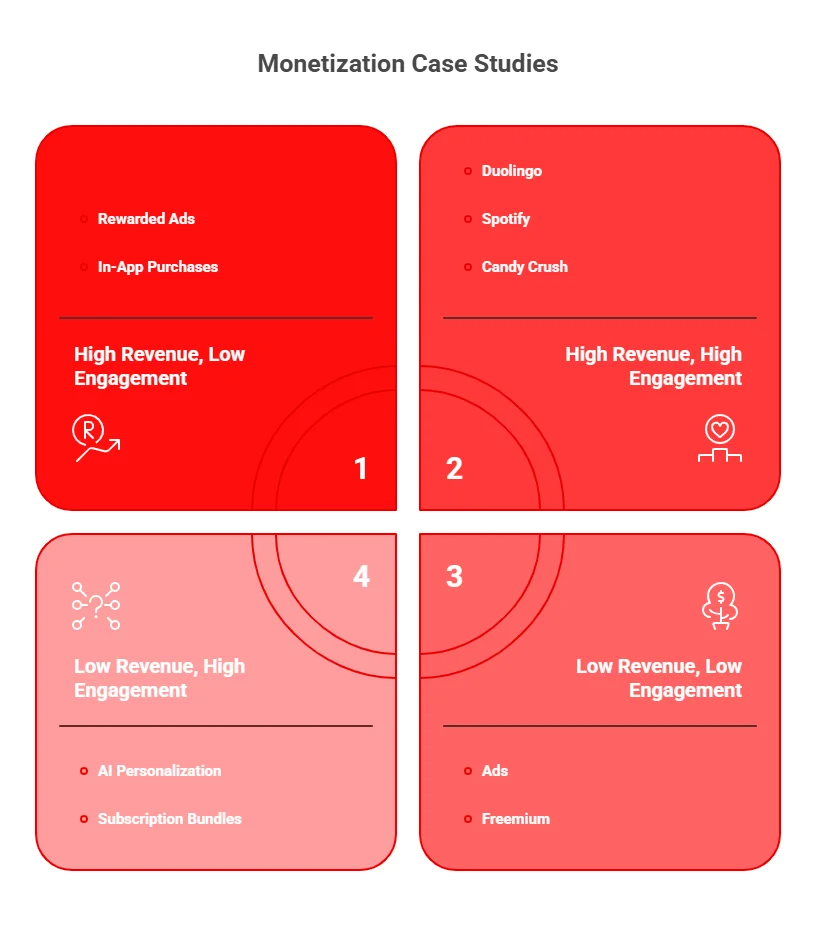
Real‑World Monetization Case Studies (2026 Trends)
Several leading apps illustrate how these trends perform in practice:
- Duolingo blends freemium, ads, subscriptions, and AI personalization. Duolingo generated ~$748M in 2024 revenue, with paid subscribers surpassing 10.9M, pushing it toward a ~$1B annual run rate.
- Spotify’s ads + premium model delivered ~€4.5B (~$4.9B) in Q4 2025 revenue alone, supported by 290M premium subscribers and 751M MAU.
- Candy Crush Saga combined IAPs and rewarded ads. It generated ~$1.09B in 2024, with $20B+ lifetime revenue, proving hybrid gaming models scale massively.
- Subway Surfers
With 4B+ downloads, Subway Surfers has generated $155M+ lifetime revenue through IAPs and ads — showcasing long-term hybrid sustainability. - Integrated rewarded ads have delivered 107%+ ROAS, directly boosting purchase-driven monetization.
Final Takeaways for Founders & Teams
App monetization in 2026 is no longer a post-launch decision; it’s a product architecture discipline that directly drives revenue and long-term growth. Key metrics we see at AppVerticals:
| Metric Category | 2026 Benchmark / Data Point |
|---|---|
| Hybrid Monetization LTV Impact | ~30% higher LTV vs single-revenue models |
| iOS Share of Global App Revenue | 60–65% |
| Android Share of Global Installs | 60–70% |
| Average Spend per App (iOS) | ~$12.77 |
| Average Spend per App (Android) | ~$6.19 |
| Average 30-Day Retention (All Apps) | ~27% |
| Retention-Optimized Growth Impact | 2–3× increase in monetizable users |
| Gaming IAP Revenue (2025) | ~$81.8B |
| Gaming Revenue Projection (2030) | $230B+ |
| Productivity App Subscription Adoption | ~30% monthly subscriber base |
| Global Subscription App Revenue (2023 baseline) | $212B |
| Hybrid Monetization ARPU Lift (Social/Streaming) | +10–25% |
| AI-Powered Conversion Lift | +15–25% |
| AI-Powered Engagement Lift | ~62% |
| AI-Powered ARPU Increase | +10–30% |
| First-Party Data Ad Revenue Impact | Up to 2× higher ad revenue |
| Web-to-App Monetization ARPU Increase | ~15% |
More Related Guides:
- AI in App Development Statistics 2026: Explores how AI integration in mobile and web apps is driving engagement, automation, and measurable ROI in 2026.
- Global Mobile App Download Statistics 2026: Highlights worldwide mobile app download trends, user growth, and adoption patterns shaping the app ecosystem.
- Telemedicine Statistics 2026: Reveals key telehealth adoption metrics, patient engagement trends, and digital healthcare growth in 2026.
- Mobile App Development Market Growth and Size Statistics: Covers global market size, growth forecasts, and investment trends in mobile app development for 2026.
- AI Chatbot Technology in 2026: Explores how AI chatbots are being adopted across mobile and web apps, driving automation, cost reduction, and measurable business ROI in 2026.
- Odoo ERP Market & Adoption Statistics 2026: Provides global user, revenue, and adoption insights, highlighting cloud, AI, and modular ERP trends driving mid-market growth in 2026.
- Mobile vs Web App Revenue Statistics 2025–2026: Analyzes global consumer spend, SaaS growth, hybrid monetization, and platform economics shaping app profitability and retention in 2026.
- AI Cloud Cost Statistics, Trends & Optimization (2026): Explores rising cloud spending, cost drivers, optimization strategies, and how AI is reshaping cloud efficiency and ROI in 2026.
- SaaS Development & Adoption Statistics 2026: Highlights global SaaS market growth, adoption trends, revenue benchmarks, churn metrics, and AI-driven innovations shaping scalable software businesses in 2026.
- E-commerce App Development Statistics 2026: Covers market size, mobile commerce growth, user behavior, AI adoption, development costs, and ROI insights shaping high-performing e-commerce apps in 2026.
- AI Automation Statistics for Enterprises (2026): Covers adoption, ROI, costs, and key trends shaping enterprise AI execution.