


 ChatGPT
 Perplexity
 Google AI
SaaS adoption is accelerating faster than ever. The global SaaS market reached $315.68 billion in 2025 and is projected to grow rapidly as businesses shift toward cloud-first operations. From enterprise adoption rates to SaaS spending and security challenges, these key SaaS development and adoption statistics reveal how the industry is evolving and what organizations should prepare for next.
In this comprehensive analysis, I will break down the most critical SaaS statistics you need to know to make informed investment decisions, optimize your tech stack, and secure your digital infrastructure.
Key Takeaways | 2026 SaaS Statistics at a Glance
- Market Explosion: The global SaaS market is projected to reach $1,482.44 billion by 2034, growing at a CAGR of 18.7%.
- Ubiquitous Adoption: 99% of organizations now use at least one SaaS solution, with the average enterprise managing 275 applications.
- Financial Waste: About 53% of SaaS licenses go unused, costing companies millions in wasted software spending.
- AI Integration: Over 80% of companies will deploy AI-enabled applications in their IT environments by 2026.
- Security Risks: Insider threats are rising, with 77% of organizations reporting insider-related data loss.
How Big Is the SaaS Market and How Fast Is It Growing?
What is the global SaaS market size expected to be by 2034?
According to recent authoritative reports, the global SaaS market was valued at $315.68 billion in 2025. Looking ahead, the forecast is even more aggressive.
North America & U.S. SaaS Forecasts
North America remains the dominant force in the global landscape, holding approximately 46.9% of the global market share.
The U.S. market alone is home to roughly 17,000 SaaS companies, far outstripping other regions. For executives, this signals that North American standards and compliance regulations will continue to dictate global trends.
| Country | Estimated Number of SaaS Companies |
|---|---|
| United States | ~17,000+ |
| United Kingdom | ~4,500 |
| Germany | ~2,900 |
| India | ~2,400 |
| Canada | ~2,100 |
Based on the latest 2026 SaaS stats reflecting company counts, revenue, and market presence.
18.7% CAGR
Projected Compound Annual Growth Rate for the Global SaaS Market (2026-2034)
Global SaaS Market Growth Projections
| Year | Projected Market Size (USD Billion) |
|---|---|
| 2025 | $315.68B – $408.21B |
| 2026 | $465.03B |
| 2029 | $793.10B |
| 2034 | $1,482.44B |
Businesses aiming to tap into this growth can rely on AppVerticals’ SaaS development expertise to build scalable and high-performing SaaS products.
Scale Smarter with Expert SaaS Development
Leverage AppVerticals’ SaaS development expertise to build high-performing, AI-enabled platforms that simplify operations and drive growth.
What Are the Latest SaaS Adoption & Usage Statistics?
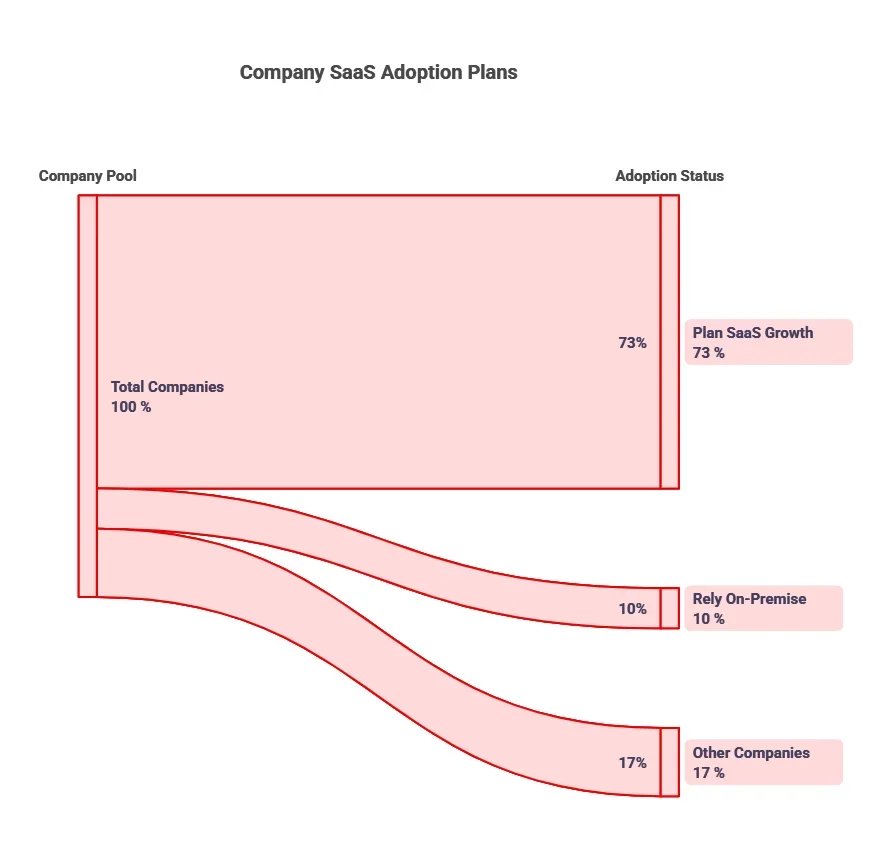
Around 73% of companies plan to grow their SaaS portfolios further, while only about 10% still rely primarily on on‑premise systems, highlighting the deep penetration of SaaS across industries.
What is the average number of SaaS apps used per company?
The volume of applications managed by IT teams is staggering. The average organization now manages 275 SaaS applications.
What are the risks of unmanaged SaaS usage in organizations?
This decentralized purchasing has led to a situation where 53% of SaaS licenses go unused, representing a massive, unseen drain on resources.
Average Number of SaaS Applications Managed by a Single Organization in 2025
What Are the Latest SaaS Spending, ROI & Financial Trends?
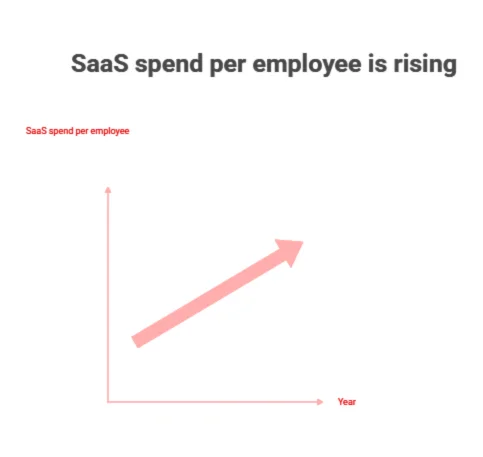
How much do companies spend on SaaS per employee on average?
The cost of equipping a modern workforce is rising. In 2025, the average SaaS spend per employee has reached $4,830, a significant 21.9% year-over-year increase. This surge is driven by vendor price hikes and the premium pricing of new AI-integrated features.
Is SaaS spending profitable for companies?
For instance, companies have seen returns as high as 338% from platforms like Slack, proving that the right tools pay for themselves multiple times over.
Average SaaS Spend per Employee by Industry (2025-2026)
| Industry Sector | 2025 Average Spend | 2026 Projected Range* |
|---|---|---|
| Healthcare | $10,150 | $11,600 – $12,000 |
| IT / Software | $10,050 | $11,500 – $11,900 |
| Finance | $8,750 | $10,000 – $10,300 |
| Retail | $7,750 | $8,900 – $9,200 |
| Global Average | $4,830 | $5,500 – $5,700 |
At AppVerticals, we help organizations track SaaS spending, benchmark costs per employee, and optimize software subscriptions to maximize ROI and control expenses.
What Are the Latest SaaS Churn & Retention Statistics?
For SaaS developers and investors, churn is the silent killer. Retention metrics are the truest indicator of product-market fit and long-term viability in a subscription economy.
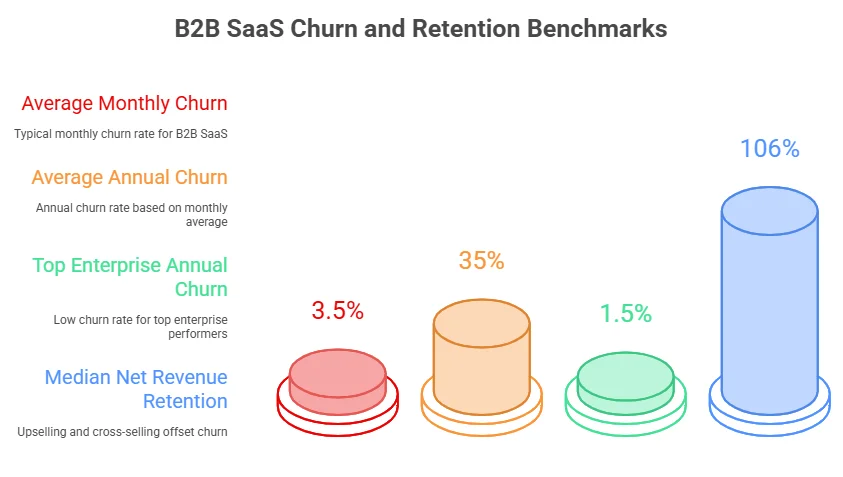
What are the average churn rate and Net Revenue Retention (NRR) benchmarks for B2B SaaS companies?
However, top performers in the enterprise space maintain annual churn rates as low as 1-2%. On the flip side, the median Net Revenue Retention (NRR) sits at a healthy 106%, indicating that upselling and cross-selling to existing customers is effectively offsetting churn.
What are the hidden churn signals in SaaS, and why do customers stop using products early?
About 92% of SaaS startups fail within the first three years, according to recent industry reporting and aggregated failure data. This reflects the brutal reality of high competition, cash‑burn pressures, and product‑market fit challenges in the SaaS space.
How Are AI and Emerging Technologies Shaping the SaaS Industry?
AI and emerging technologies are powering smarter SaaS platforms, driving automation, predictive insights, and personalized experiences that boost efficiency and business value.
How is AI adoption and agentic AI transforming the SaaS industry?
How much time does SaaS automation save employees?
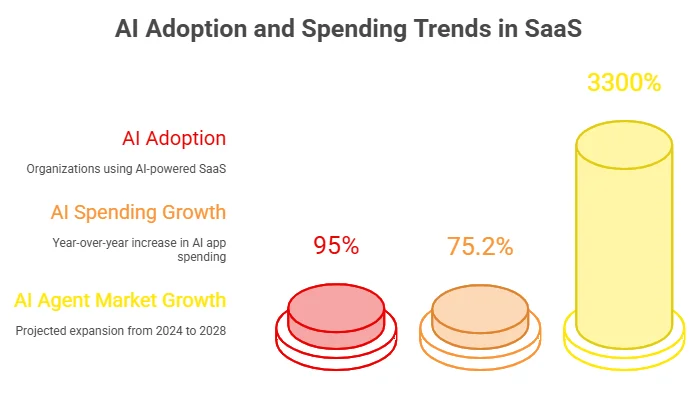
The efficiency gains are measurable and massive. Agentic AI is expected to automate 15% of work decisions by 2028. Already, sales professionals are saving over 2 hours daily through SaaS automation tools, fundamentally altering workforce productivity dynamics.
Year-over-Year Increase in Spending on AI-Native SaaS Applications
What Are the Key Industry-Specific Trends in SaaS?
SaaS adoption varies by industry, with sectors like finance, healthcare, and retail leading in cloud adoption. Tailored solutions help businesses streamline operations, improve compliance, and enhance customer experiences within their specific industry.
How are healthcare and finance industries driving SaaS adoption and what are the key market trends?
How profitable is Micro-SaaS and how quickly do Micro-SaaS businesses reach profitability?
On the smaller end of the spectrum, the Micro-SaaS model is thriving. These niche, low-overhead businesses are proving highly resilient.
What Are the Latest SaaS Security and Governance Statistics?
What are insider threats in SaaS and how serious are SaaS security and governance risks?
Even more concerning, 77% of organizations have reported data loss related to insider actions, underscoring the urgent need for stronger governance and SaaS Management Platforms (SMPs).
What Are the Key SaaS Trends and Future Forecasts?
Global SaaS revenue is projected to reach $908 billion by 2030. The infrastructure supporting this will be hybrid, with 90% of organizations expected to adopt hybrid cloud strategies by 2027. We will also see a massive wave of consolidation, as companies seek to reduce app sprawl and integrate disparate tools into unified platforms.
Expert Opinion:
The future of SaaS is increasingly moving toward integrated, AI-enabled platforms that simplify operations rather than adding more fragmented tools. Businesses are becoming overwhelmed by managing dozens of disconnected applications for accounting, CRM, inventory, project management, and customer support. As a result, there is a growing shift toward unified ecosystems where multiple business functions operate within a single platform.
Solutions like Odoo illustrate this trend by offering a modular yet integrated approach, allowing companies to scale their digital infrastructure without the complexity of stitching together numerous SaaS products.
In the coming years, successful SaaS platforms will likely be those that combine deep functionality, seamless integration, and intelligent automation to deliver not just software, but a cohesive operational system for businesses.
Real-World Case Studies
1. Zoom’s Pandemic Growth
This growth was not just an anomaly; it set a new baseline for remote collaboration infrastructure, proving that SaaS platforms must be built to scale elastically overnight.
2. NinjaOne: Rapid Expansion in 2025–2026
While Zoom remains the classic scalability example, NinjaOne’s explosive growth in 2025–2026 shows how modern SaaS platforms are flourishing outside the pandemic context.
The company now serves over 35,000 customers across 140+ countries, representing 60 % customer growth over the prior year — a clear signal that next‑gen SaaS tools are scaling rapidly in mid‑market and enterprise segments.
3. Slack and Salesforce
Conclusion
The SaaS statistics for 2026 paint a clear picture: the industry is maturing, expanding, and becoming more expensive to navigate.
The tools you select today, and how you manage them, will define your operational efficiency for the next decade.
More Related Guides:
- AI in App Development Statistics 2026: Explores how AI integration in mobile and web apps is driving engagement, automation, and measurable ROI in 2026.
- Global Mobile App Download Statistics 2026: Highlights worldwide mobile app download trends, user growth, and adoption patterns shaping the app ecosystem.
- Telemedicine Statistics 2026: Reveals key telehealth adoption metrics, patient engagement trends, and digital healthcare growth in 2026.
- Mobile App Development Market Growth and Size Statistics: Covers global market size, growth forecasts, and investment trends in mobile app development for 2026.
- AI Chatbot Technology in 2026: Explores how AI chatbots are being adopted across mobile and web apps, driving automation, cost reduction, and measurable business ROI in 2026.
- App Monetization Statistics 2026: Breaks down global app revenue benchmarks, monetization models, retention metrics, and AI-driven growth strategies shaping profitable apps in 2026.
- Odoo ERP Market & Adoption Statistics 2026: Provides global user, revenue, and adoption insights, highlighting cloud, AI, and modular ERP trends driving mid-market growth in 2026.
- Mobile vs Web App Revenue Statistics 2025–2026: Analyzes global consumer spend, SaaS growth, hybrid monetization, and platform economics shaping app profitability and retention in 2026.
- AI Cloud Cost Statistics, Trends & Optimization (2026): Explores rising cloud spending, cost drivers, optimization strategies, and how AI is reshaping cloud efficiency and ROI in 2026.
- E-commerce App Development Statistics 2026: Covers market size, mobile commerce growth, user behavior, AI adoption, development costs, and ROI insights shaping high-performing e-commerce apps in 2026.
- AI Automation Statistics for Enterprises (2026): Covers adoption, ROI, costs, and key trends shaping enterprise AI execution.
- Google Play Store Statistics 2026: This article delves into the latest Google Play Store statistics for 2026, focusing on app download trends, user engagement, and the rising dominance of AI-driven applications.